Data Filtering
Certain runs have been observed to display data that was introduced during periods in which the detector was malfunctioning. These periods manifest themselves in various way via mass plots (see figure 1).
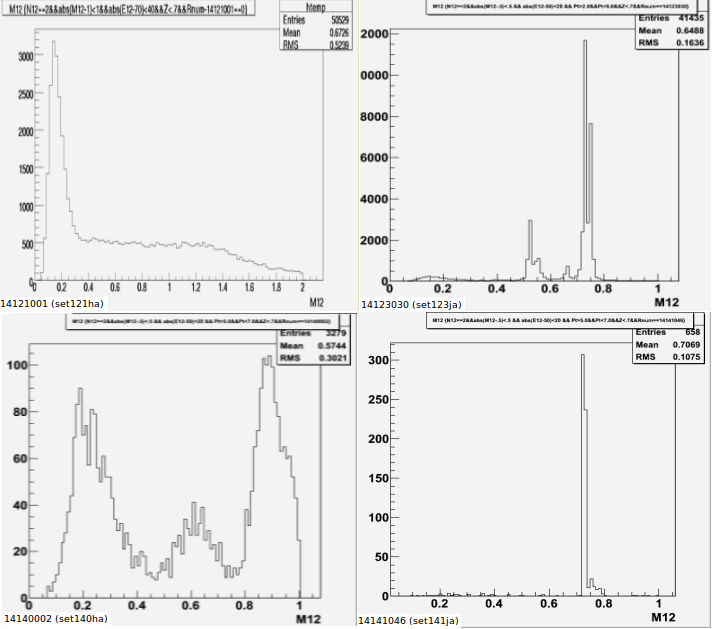
Figure 1 - M12 plots for various runs. The plots are expected to be like that of run 14121001 (upper left). The cut applied to generate these plots was:
" N12==2&&abs(M12-1)<1&&abs(E12-70)<40&&Z<.7"
A filter method has been developed to combat this bad data. The main assumption used by this filter are that the detector acts up over some time period throughout a run. Using this assumption a method was developed which generates error codes based on the last 100 events. If a certain percent of the last 100 runs fall within a known bad region then the event is marked as a bad event so that it can be removed later in analysis. The filter originally involved hard coding several filters which seemed to be commonly occurring but the filter has been expanded to accept custom filter methods. These method are in the form of a typical ROOT cuts (i.e. "abs(Phi-2.2)<.1") and can be determined by observing Phi vs Eta plots (figure 2).
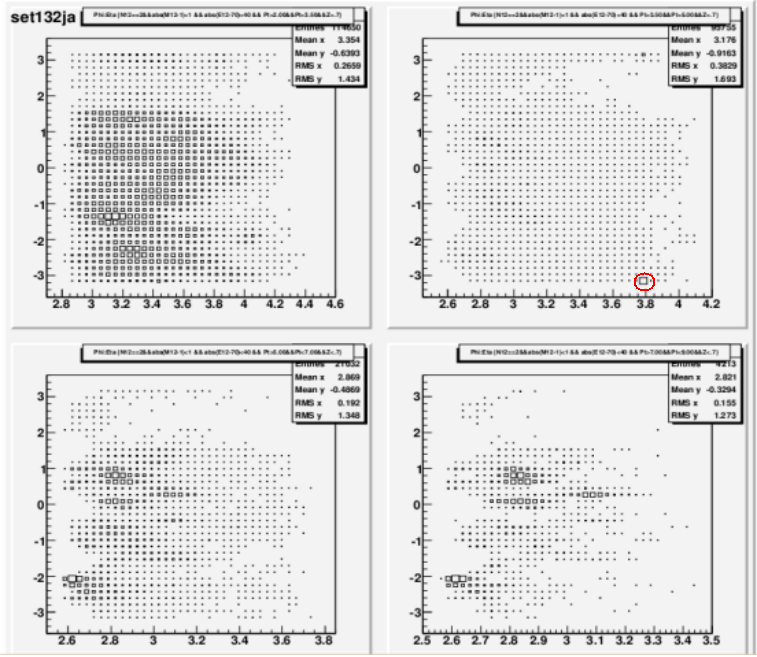
Figure 2 - Phi vs Eta plots for set132ja. The four pictures correspond to four regions of Pt. A bad data peak has been circled in red. The cuts used in these plots was:
" N12==2&&abs(M12-1)<1&&abs(E12-70)<40&&Z<.7"
The filter method currently used text files to determine the filter method (hard-coded or custom) and a single custom filter has been created. This file cuts exclusively on Phi and Eta and does a fairly decent job at filter bad data. Future plans involve creating more custom filters to determine the exact nature of the bad data. The current filter file can be found as an attachment. This page will be updated as filter methods progress.
LAST UPDATED: (7/9/13 @ 11:30 AM EST)
- kbron's blog
- Login or register to post comments