- kikola's home page
- Posts
- 2023
- 2021
- 2017
- December (1)
- 2016
- 2015
- 2014
- December (2)
- November (2)
- October (3)
- September (1)
- August (3)
- July (2)
- June (2)
- April (3)
- February (3)
- January (1)
- 2013
- December (2)
- October (4)
- September (2)
- August (2)
- July (2)
- June (3)
- April (4)
- March (4)
- February (1)
- January (2)
- 2012
- December (2)
- October (2)
- September (3)
- August (3)
- July (7)
- June (1)
- April (1)
- March (2)
- February (2)
- January (1)
- 2011
- 2010
- 2009
- 2008
- My blog
- Post new blog entry
- All blogs
Simulations of Au+Au 200 GeV run 10 min-bias events - simple QA
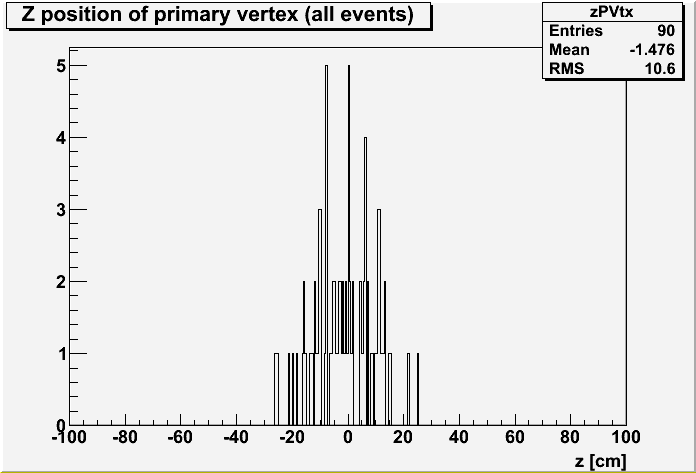
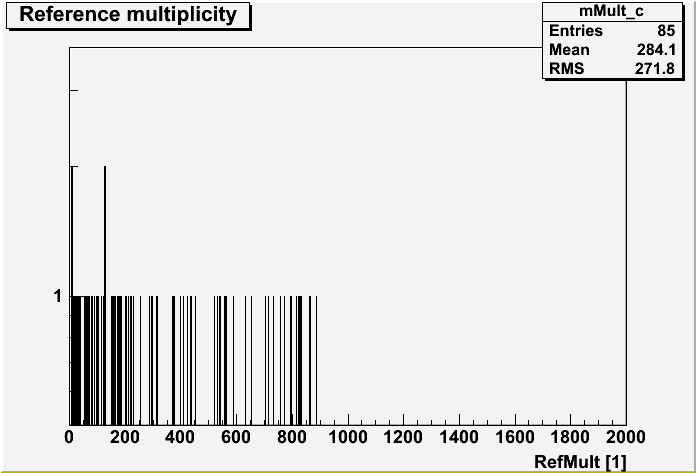
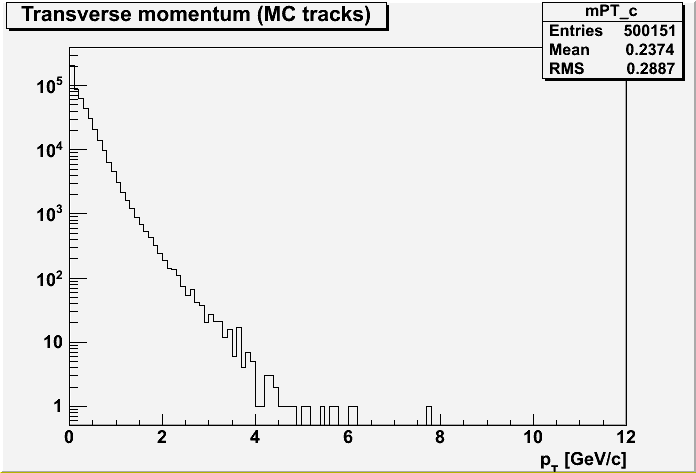
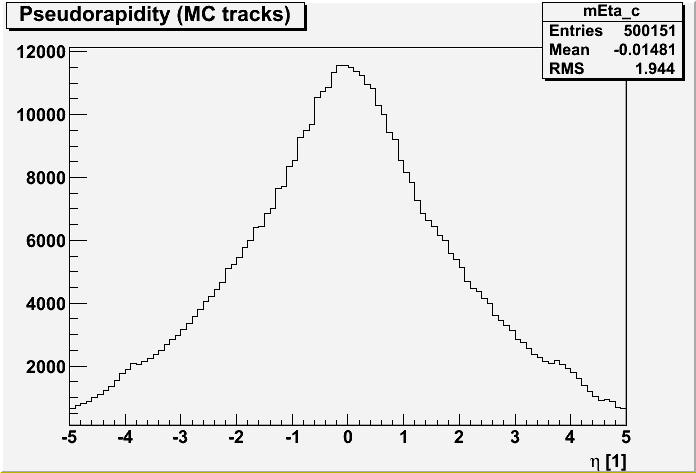
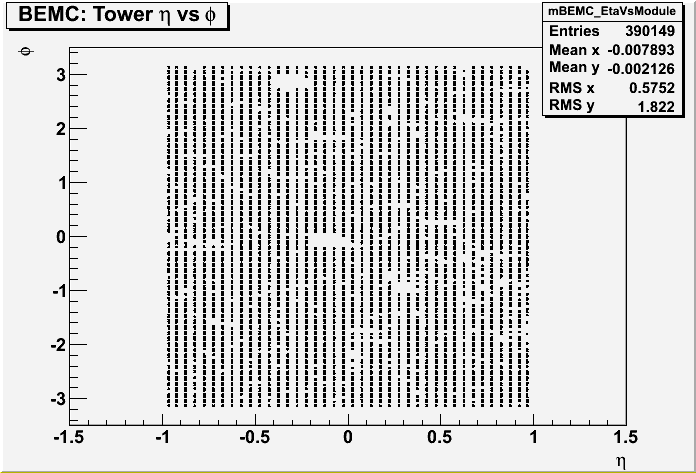
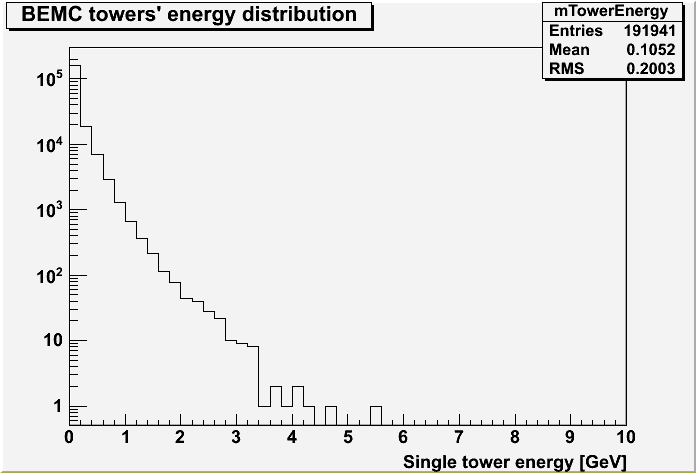
This is a simple QA for simulations of Au+Au 200 GeV run 10 min-bias events.
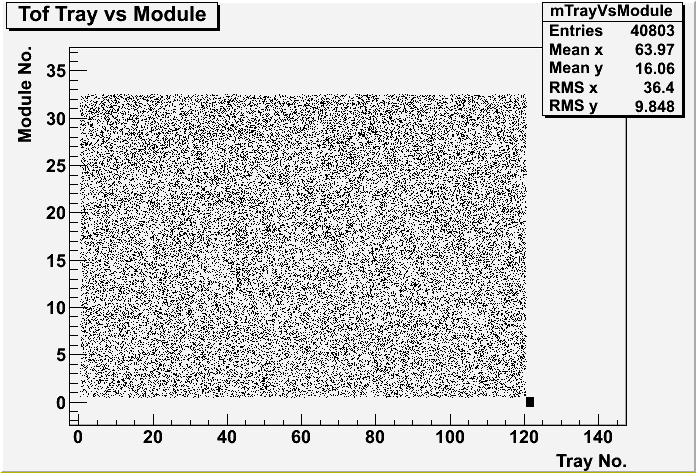
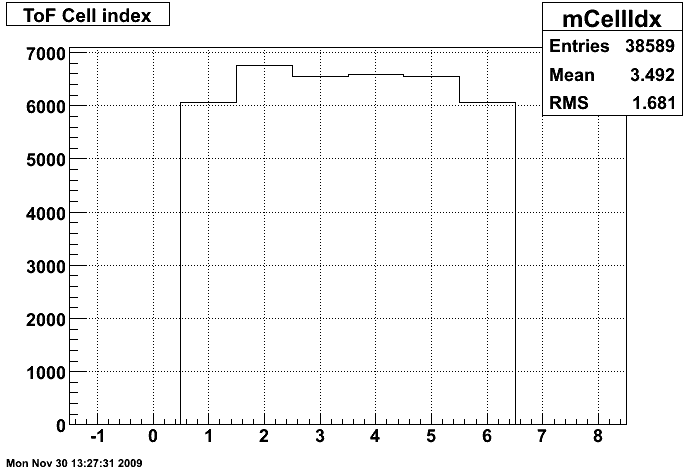
From the point of view of the goal of the studies (Low-pT J/psi trigger performance test) the data are ok: single track distributions look reasonable, as well as BEMC and ToF histograms.
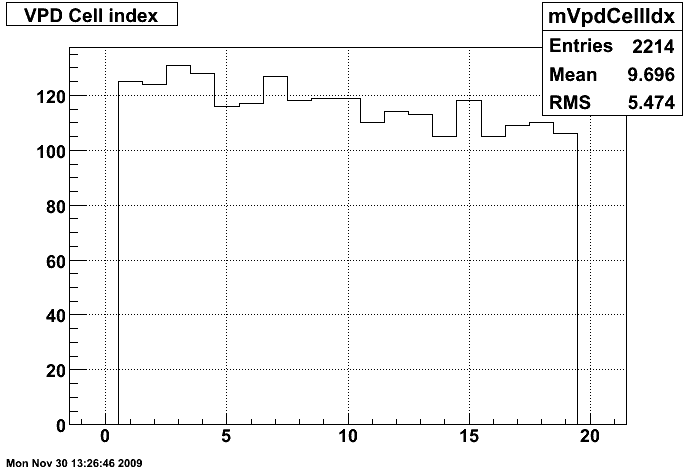
One thing which I don't really understand is a few entries in ToF tray Vs module histogram with try no. > 120 and entries in ToF Cell index histogram with cell index > 6 (two last histograms).
Update: As it was explained by Frank Geurts, Tray-IDs 121 and 122 are the two VPDs, and not real TOF trays. The associated cell index runs from 1-19, representing the 19 PMT tubes per VPD.
I checked the cell index for real ToF trays (Tray-IDs =< 120) and it runs from 1-6, while for Tray-IDs > 120 the cell index runs from 1-19 as it was expected.


- kikola's blog
- Login or register to post comments
