Pion Mass vs Energy
I've been looking at how the pion mass peak moves as a function of the energy (E12). To do this, I created several histograms of M12 each correspoinding to a 5GeV energy range. For each histogram, I fit the very top of the pion mass peak with a gaussian to determine the pion mass as in the figure below.

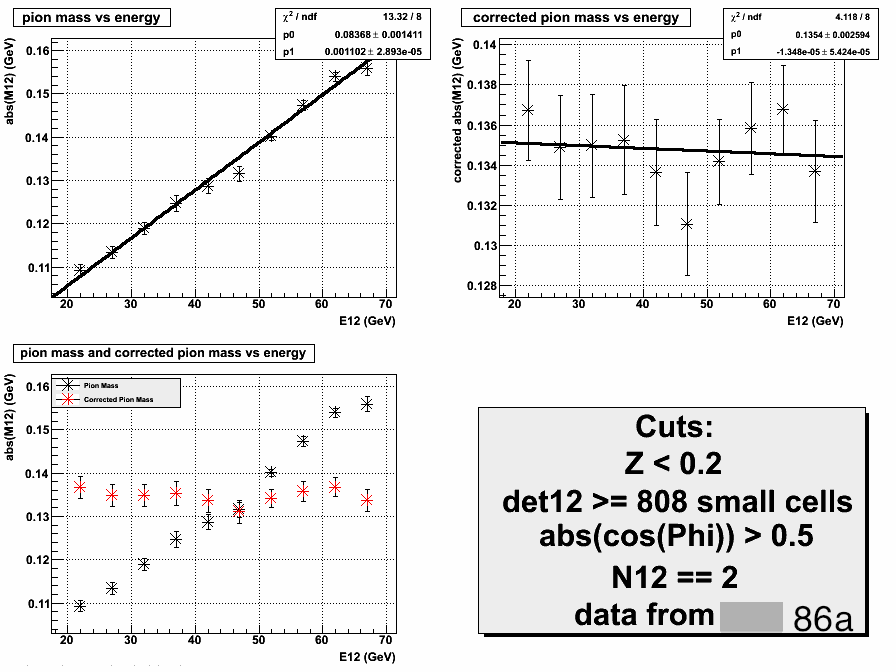
Once I have the value for the pion mass for different energies, I plot it vs E12. The range of E12 used was 20 GeV to 70 GeV. The reason for this is that past 70 GeV the number of histogram entries started becoming to few to have a good gaussian fit of the mass peak. Over this range of energies, the plots were very linear. A linear fit of the data was made and used to calculate a corrected pion mass, which should be consistent with .135 GeV. This was done for many data sets and for both the large and small detector cells.
For the large cells, the value for the pion mass ranged from .12 GeV at low energy to .26 GeV at high energy. The shift of pion mass wasn't as drastic for the small cells, as it ranged from .11 GeV to .16 GeV. Some of these plots are presented below.
Here are plots for the large cells:
.gif)
.gif)

Here are plots for the small cells:
.gif)

.gif)
I also looked at one data set with Z > 0.7 for large cells. This showed the same linear trend as seen for Z < 0.2 although not as clean.
.gif)
As you can see, the plots made with Z > 0.7 cut is not nearly as nice of a fit as for the Z < 0.2 cut.
- klandry's blog
- Login or register to post comments
