x1 vs pt
Using simulation data, I'm looking at the relationship between momentum fraction x1 and the transverse momentum observed in pi+ pi- pairs.
The data used was pp200 GeV 2006 geometry.
The files used are located /star/data47/reco/pp200/pythia6_410/
The cuts I used were:
abs(eta) < 1.4
dca < 2
trackPt > 0.5 (I also did the same thing for trackPt > 1.5)
nHitsFit > 15
I made a pi+ pi- pair out of every combination of positively and negatively charged tracks which passed my cuts and also were within a radius of 0.3 in eta and phi. I then recorded the momentum fraction x1 for each of these pion pairs.
I also selected out events which satisfied either JP1, JP2, of HT triggers and compared this to events which did not satisfy this condition.
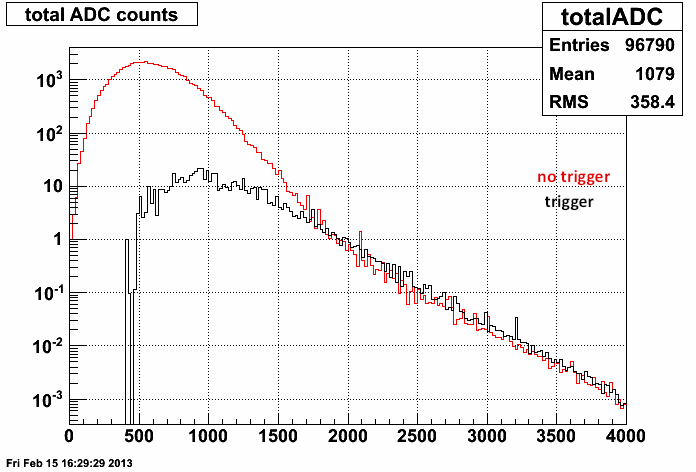
To compare the difference between having these triggers fired or not, I made a histogram containing the sum of the ADC counts from all towers in the BEMC. When none of these triggers fire, there is a large amount of events with very low energy in the BEMC. Requiring one or more of these triggers to fire cuts this out.
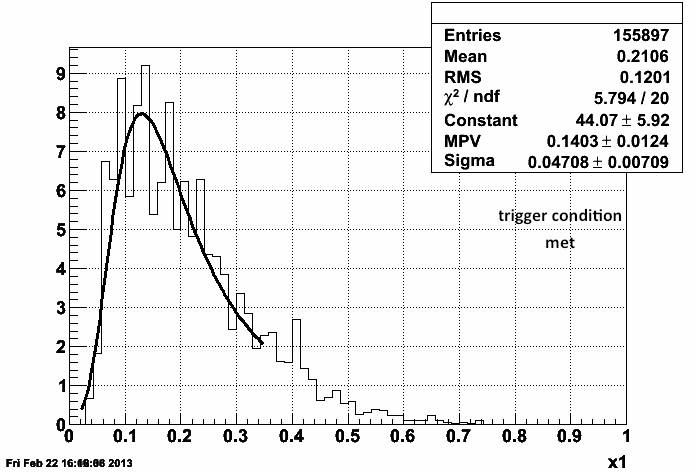
I start the analysis by plotting x1 for 5 different pt bins. These are 0-2, 2-4, 4-6, 6-8, and 8-10. I then fit each plot around its maximum with a landau distribution and find the position of the maximum. Here is an example from pt bin 4-6. In this case the trigger condition was met. The error on the position of the maximum is taken to be where the half max occurs on either side.
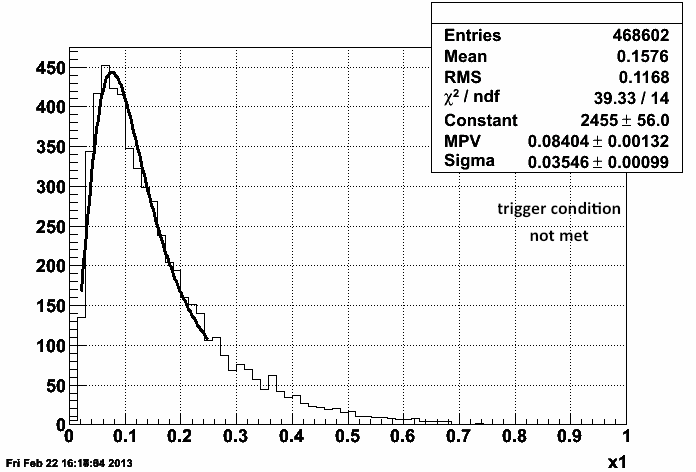
To compare this to when the trigger condition isn't met, I do the same procedure to find the position of the x1 peak when these triggers didn't fire. The figure bellow is also from pt bin 4-6 to compare with the previous figure.
After finding the position of the x1 peak for all momentum ranges and both trigger conditions, I plot the results. As the transverse momentum of the pi+ pi- pair increases, so does the value of x1. When the trigger condition is met, this increase is steeper, and the value of x1 is always larger than when the trigger condition is not met.
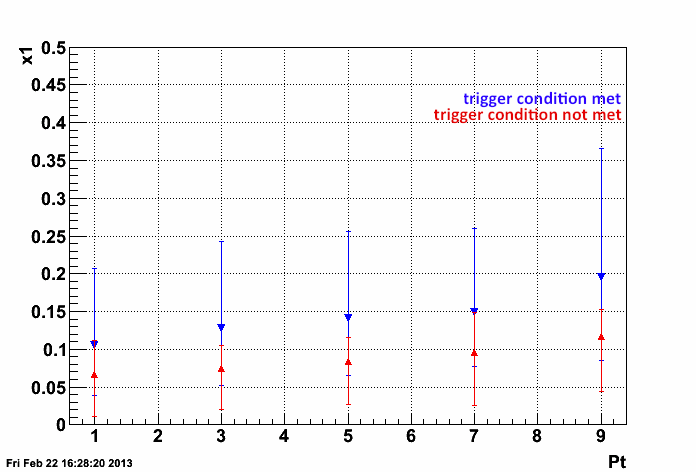
The above plot is with a trackPt > 0.5 cut for track selection.
Here is the result for trackPt > 1.5.
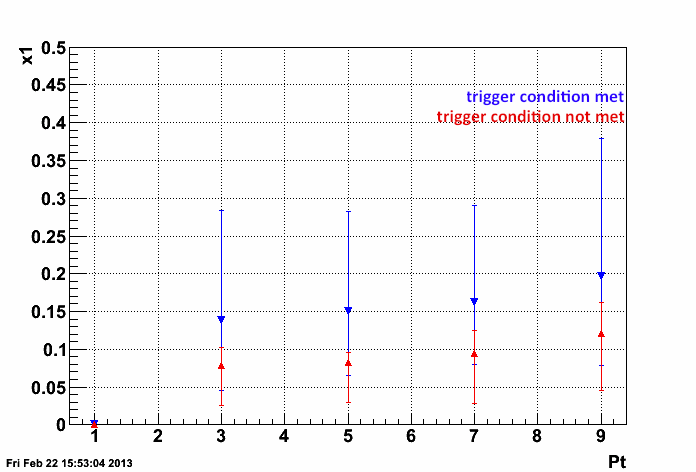
This is very similar to the result when using trackPt > 0.5 GeV to select tracks. It doesn't seem like the trackPt cut changes much. The slopes are very close in value. Using pt>0.5 gives a slope of .009 while pt>1.5 gives a slope of .008. The intercept for pt>1.5 is slightly larger at .108 than for pt>0.5, which is .096.
- klandry's blog
- Login or register to post comments
