Z for pion pair in simulation
In a previous post, I described my work on determining x1 from simulation data. Now I'm looking at Z in simulation data. All cuts are the same as in my previus post about x1.
My definition of Z:

Definition of Z from StChargedPionJetParticle:

Definition of Z using jet momentum:

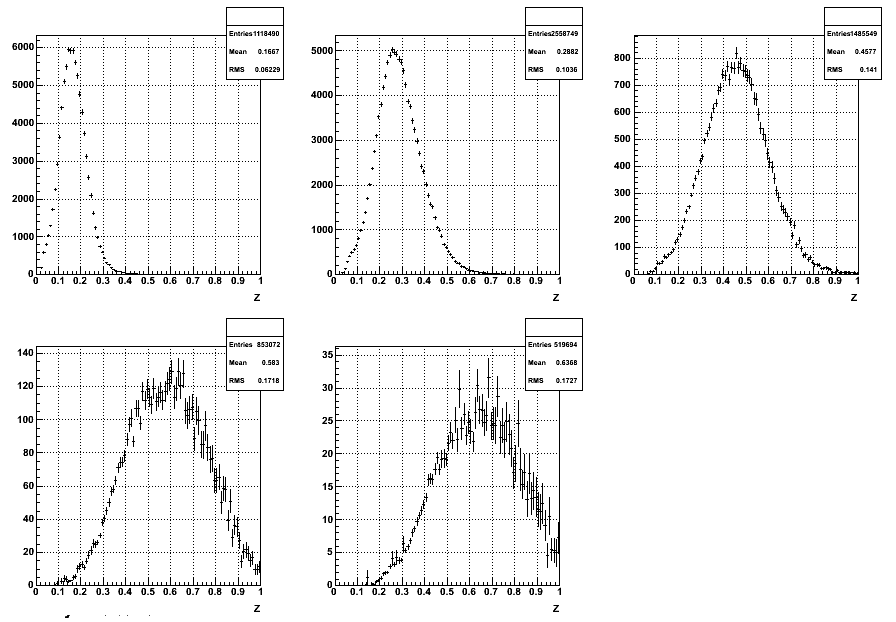
Plot of Z for different Pt Bins in the simulation.

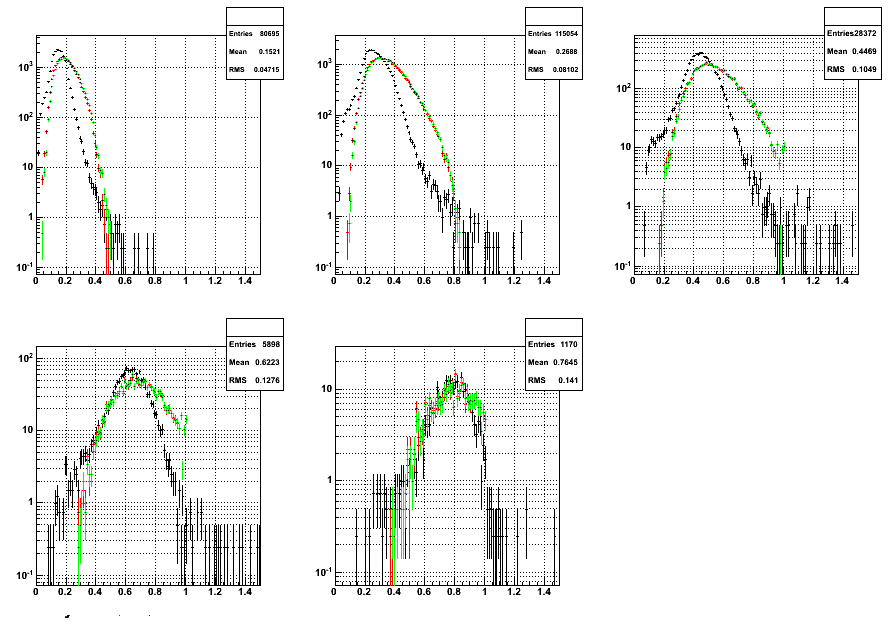
I noticed there were several instances where Z = 1 especially in the largest Pt bin. Since I was only plotting from 0 to 1, I decided I would plot from 0 to 1.5 to see if there are any instances of Z > 1. I also compared my definition of Z with the other two. Also instead of using all the data from the simulation, I just did this for 2 different ranges in the simulation.
9-11 GeV:
In this plot, My definition of Z is the black points, the red points correspond to the Z returned by the function in StChargedPionJetParticle, and the third Z definition are the green points. The red and green points fall almost directly on top of each other, but differ by a significant amount from the black points. Sure enough, when I plot to Z = 1.5, there are some instances where my definition of Z results in a value of Z greater than 1. The other two definitions do not have this feature. The second plot is identical except plotted on a log scale.


15-25 GeV:
For 15-25 GeV, there are no longer any points greater than 1. Again the red and green points lie directly on top of each other and differ from the black points. Overall the value of Z is less in each Pt bin than the corresponding value of Z from the pot above. This makes sense because a lower energy of the partons involved in the collision requires a higher fraction of the the parton momentum go into the pion pair to attain the the same Pt.

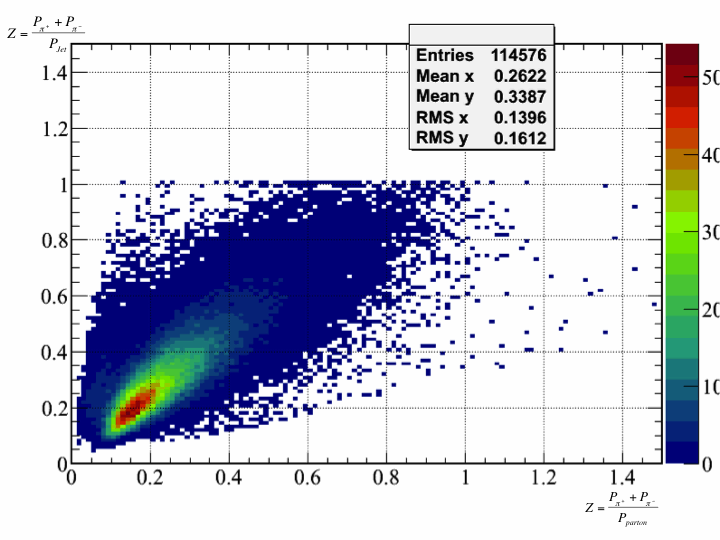
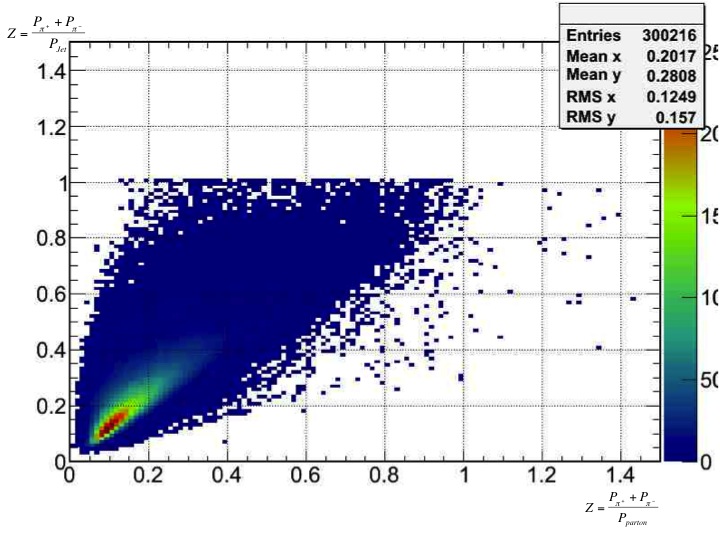
Plot of "my definition of Z" vs "definition of Z using jet momentum"
9-11

15-25

- klandry's blog
- Login or register to post comments
