Z, x1, and x2 for different mass/eta/pt bins
Continuing from my previous posts on Z, x1, and x2 for pi+/pi- pairs, in this post I am using simulation data to determine x1, x2, and z for all combinations of invariant mass, eta, and pt bins. My invariant mass eta and pt binning scheme is the same as Anselm's binning scheme for his IFF analysis.
Here is the binning I used.
pt bin number: 0 1 2 3 4
pt: 3.0-4.0 4.0-5.0 5.0-6.5 6.5-8.0 8.0-1000.0
invariant mass bin number: 0 1 2 3 4
invariant mass: 0.0-0.4 0.4-0.6 0.6-0.8 0.8-1.0 1.0-100.5
eta bin number: 0 1 2 3
eta: -1.4- -0.5 -0.5-0.0 0.0-0.5 0.5-1.4
Z:
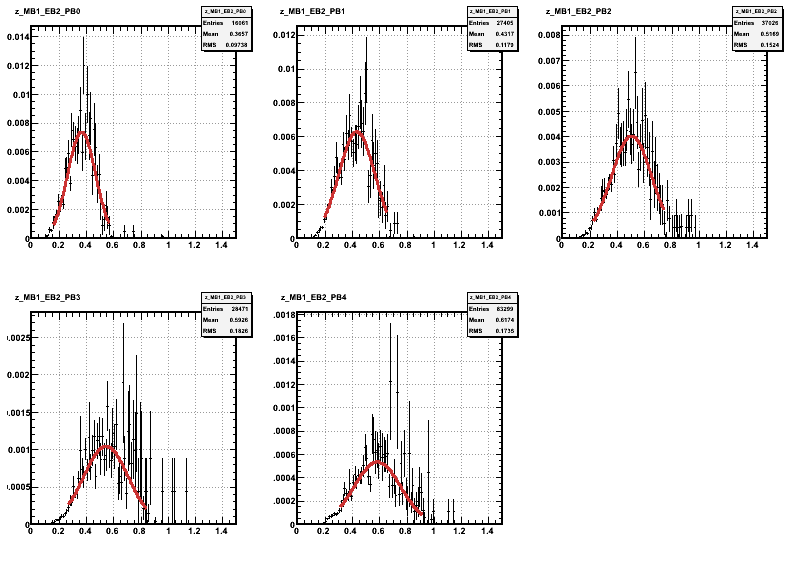
I plot Z for each bin combination and fit each plot with a gaussian. To get the range of the fit, I looked for the first time on either side of the peak where there were three consecutive bins which had values larger than 1/2 the average value of all the histogram bins. This seemed to give a good window for the fit in almost all cases.
Z for 2nd invariant mass bin, 3rd eta bin, and all 5 pt bins.
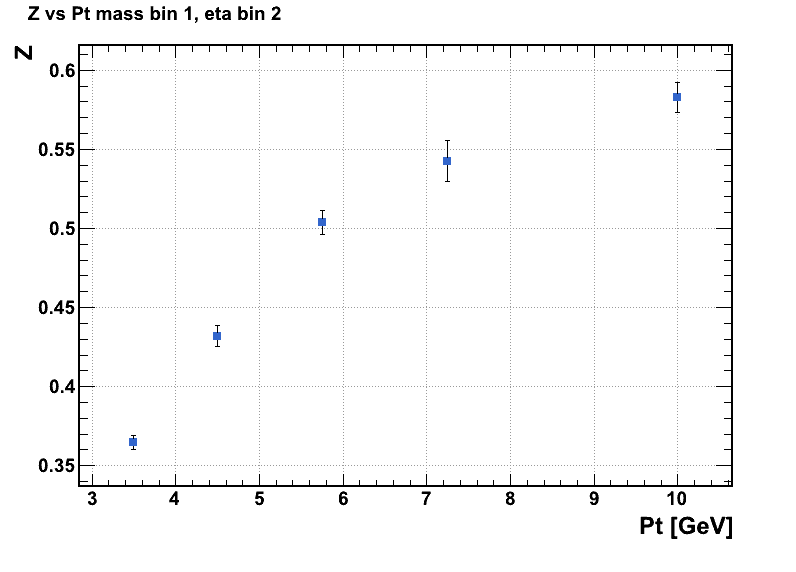
Plot of Z vs Pt corresponding to the above plot.
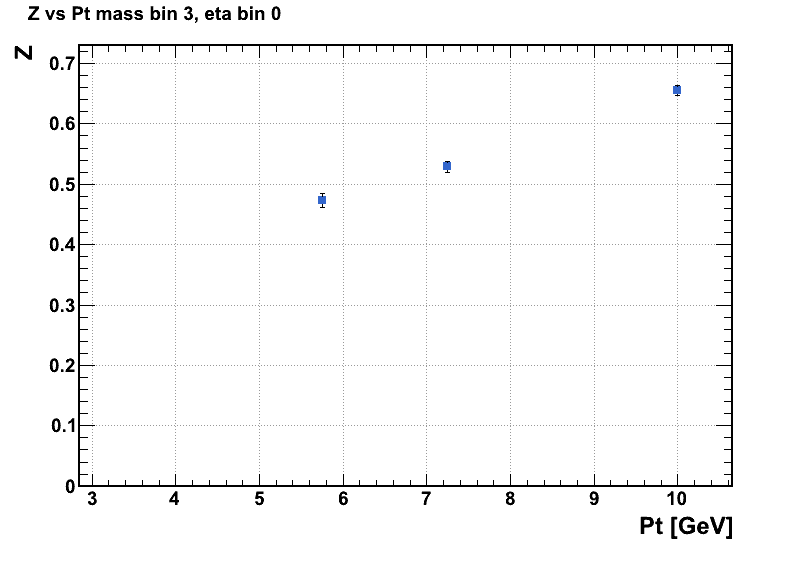
In some cases, not all the combinations of invariant mass, eta, and pt bins would be filled. In cases where the histogram for a certain bin had less than 100 entries, I would just throw it out. This makes sense because in order to get a large invariant mass, you are going to need larger pt's also.
An example of this is invariant mass bin 3, eta bin 0. Here the first and second pt bins didn't have enough entries.

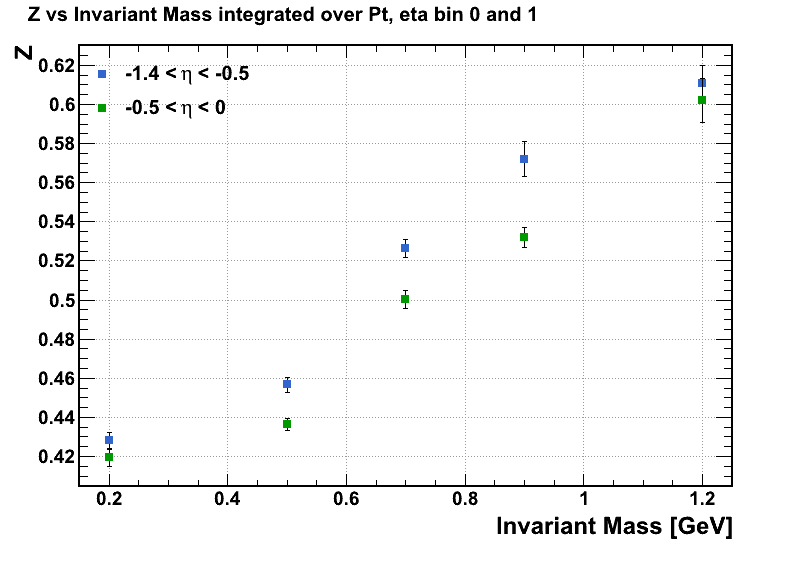
Integrating over invariant mass bins:
.gif)
.gif)
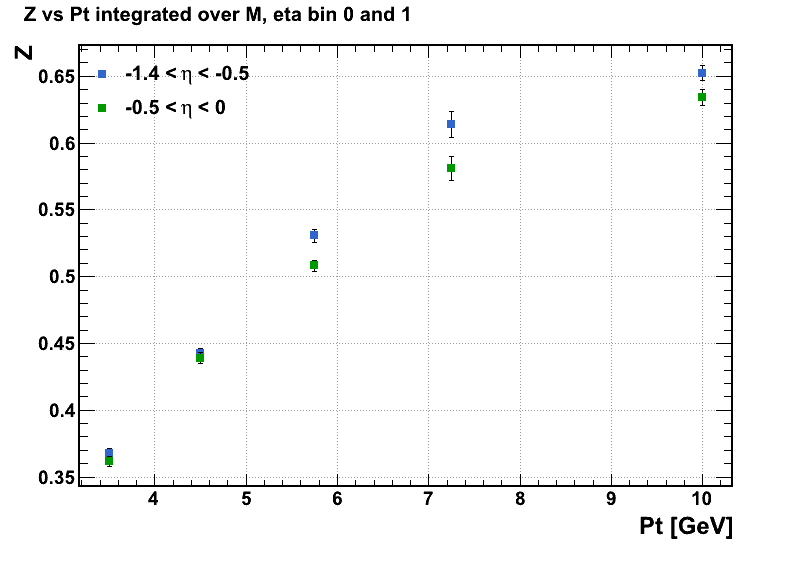
Integrating over Pt bins:
.gif)
.gif)
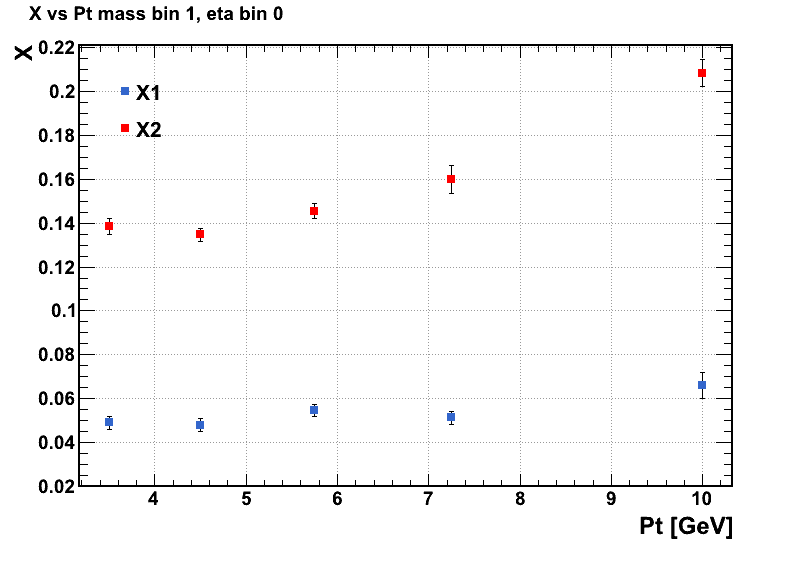
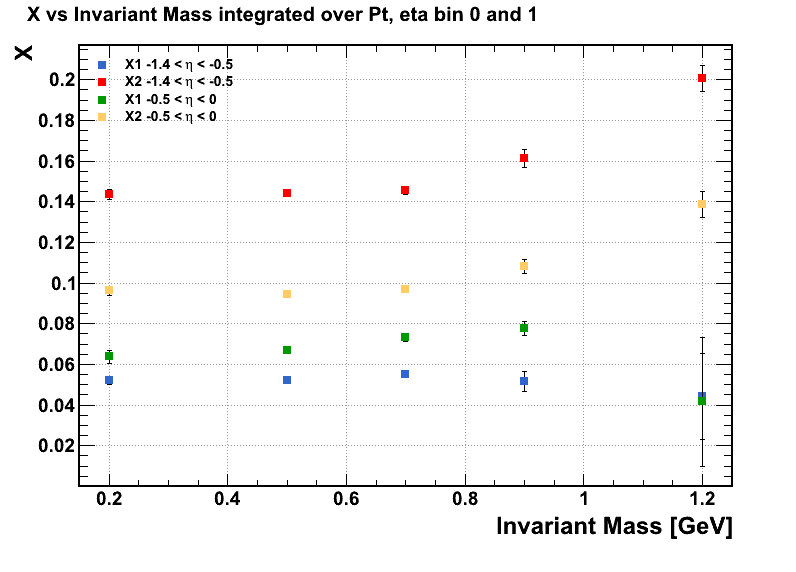
X1 and X2:
For x1 and x2, I fit with a landau distribution to determine x. The range of the fit was determined the same way as for Z.
X1 for mass bin 1, eta bin 0, all pt bins
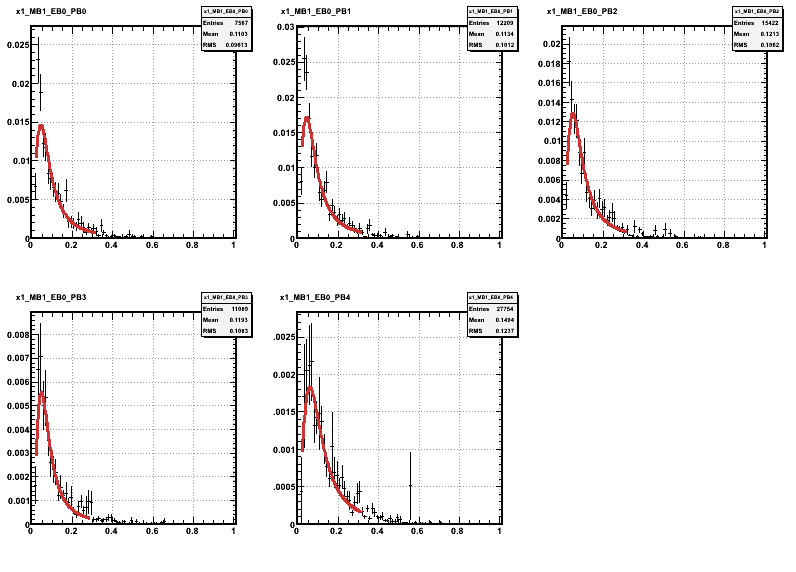
X2 for mass bin 1, eta bin0, all pt bins

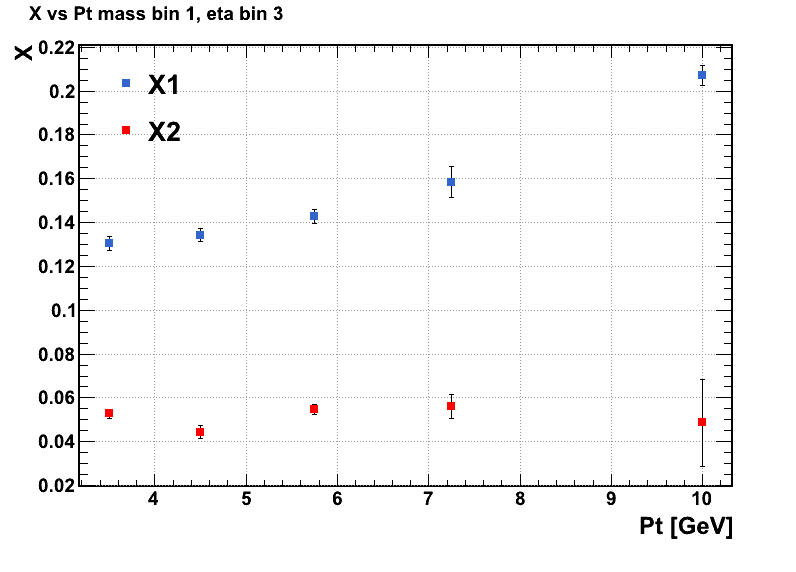
.gif)
Cuts:
abs(eta) < 1.4
abs(vertexZ) < 60
nHitsFit > 15
abs(Dca) < 2
trackpt > 1.5
Location of simulation Data:
pp 200 GeV 2006 Geometry
/star/institutions/uky/wwitzke/trees/simulation2/
Fits for other invariant mass/eta/pt bins can be found
Z: drupal.star.bnl.gov/STAR/z%20fits%20for%20all%20bins
X1: drupal.star.bnl.gov/STAR/blog/klandry/2013/jun/06/all-fits-x1-simulation-2006-geometry
X2: drupal.star.bnl.gov/STAR/blog/klandry/2013/jun/06/all-fits-x2-simulation-2006-geometry
other fits when integrating over invariant mass or pt:
drupal.star.bnl.gov/STAR/blog/klandry/2013/jun/06/integrated-fits-z-simulation-2006-geometry
Tables of X1 X2 and Z values for each bin are attatched below.
- klandry's blog
- Login or register to post comments
