4.5 GeV Au + Au Simulated FXT Vertex Reconstruction
Goal: to generate simulated fxt events for the 2015 4.5 GeV Au + Au run.
Method: Generate events in URQMD --> STARSIM --> BFC
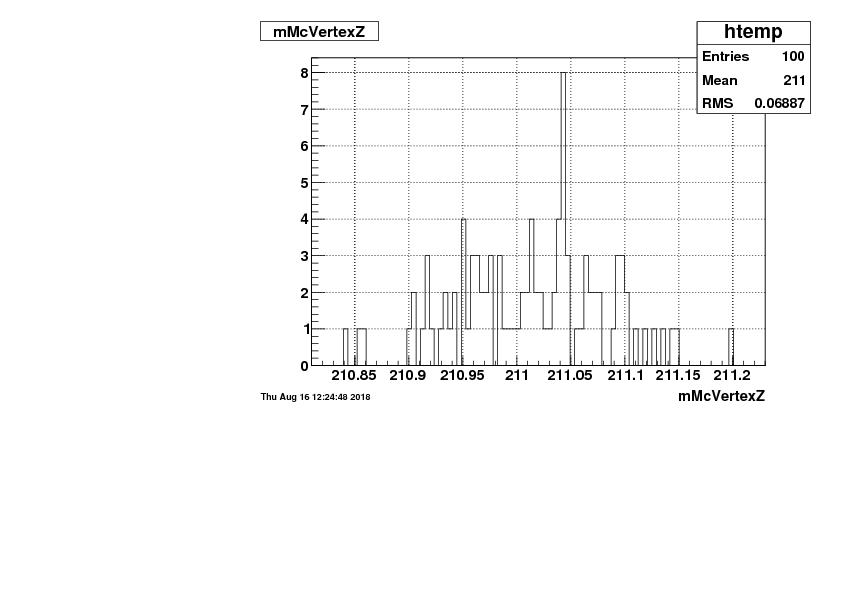
The plots below are from the minimc.root files output by the BFC.
Issue: The positions of the monte-carlo vertices are drawn from the data distribution which is a narrow peak around 211 cm in Z.
However, the Z vertex distribution of these simulated vertices AFTER being reconstructed by the BFC is completely different:
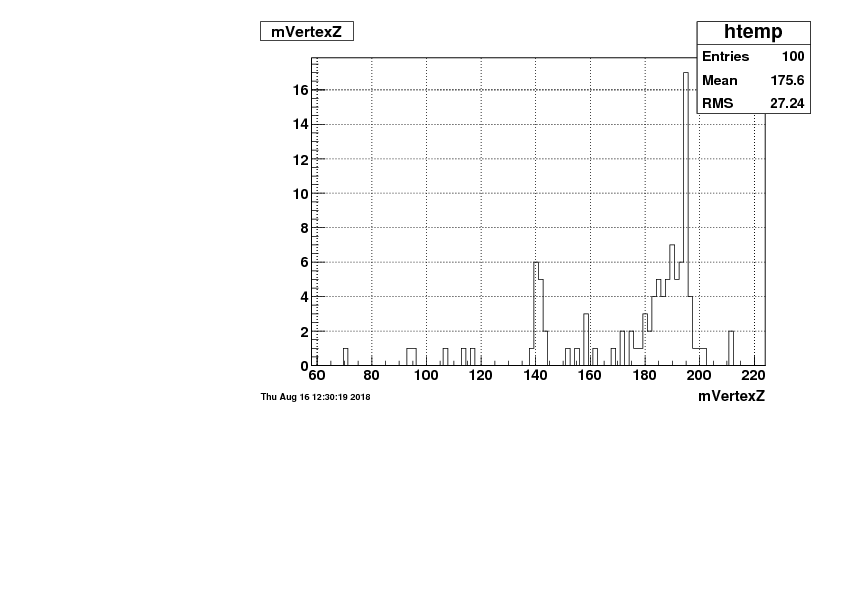
To run the BFC I used SL16d and I've experimented with a variety of chain options, most recently:
DbV20160126 DbV20150920_tpc_Calibrations y2015b geantout BemcChkStat UseXgeom AgML TpcFastSim VFMinuit ITTF ZDCvtx tpcDB MakeEvent mtd McEvent IdTruth -dstout big fzin MiniMcMk btof CorrX -hitfilt
I've also tried without the two DbV commands and still see the same issue.
- kmeehan's blog
- Login or register to post comments