Preliminary Plots from root(s) = 4.5 GeV Au + Au FXT 2015 Shown at Quark Matter 2017
The preliminary plots below were presented for the first time at the 2017 Quark Matter Conference in Chicago, IL, U.S.
The slides can be found here.
.png)
Plot: Negative Pion Spectra for the top 5% centrality bin. Download PDF
Analyzer: Kathryn Meehan, UC Davis

Plot: Negative pion dN/dy for the top 5% centrality. Download PDF
Analyzer: Kathryn Meehan, UC Davis

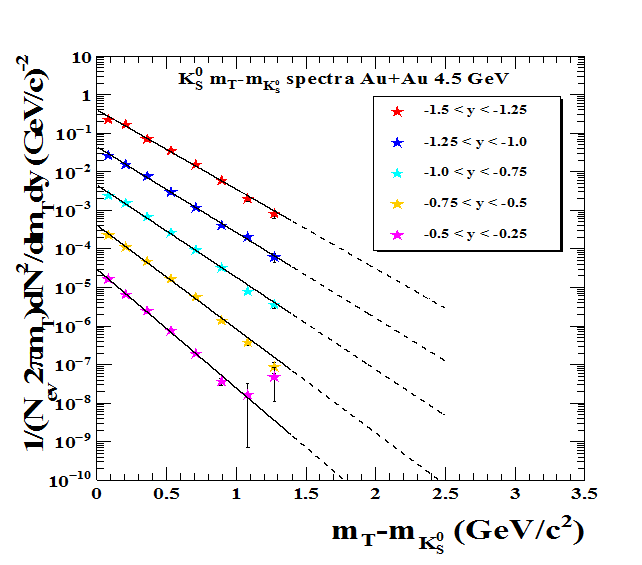
Plot: K0s spectra for the top 5% centrality. Download PDF Download PNG
Analyzer: Usman Ashraf, Tsinghua University
Note: I do not have the original PDF version so I converted it and the resolution is not very good. Please contact Usman if you need a better resolution PDF version.

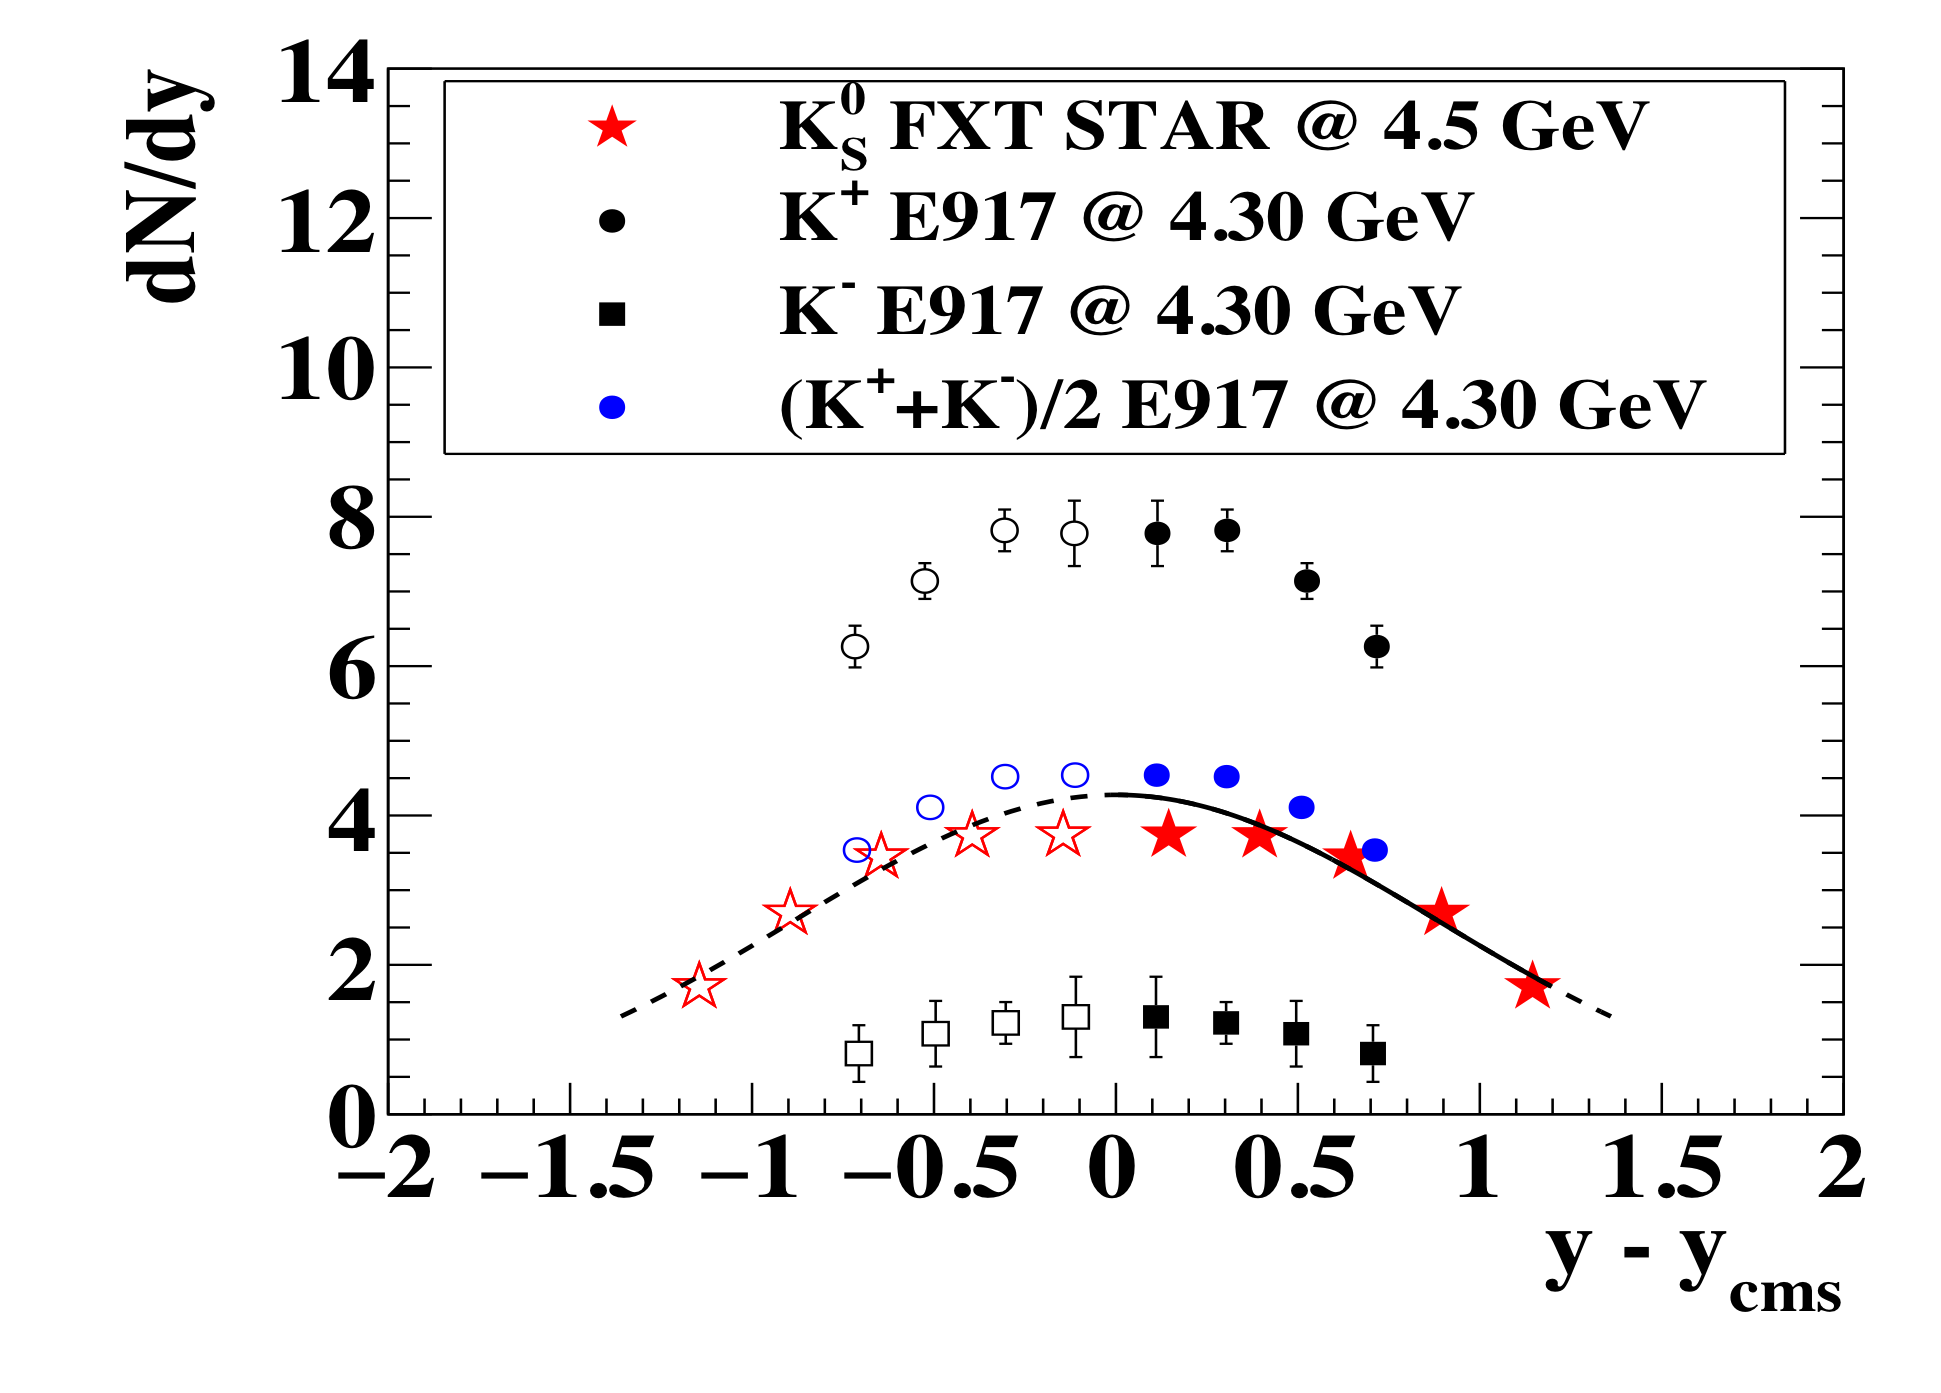
Plot: K0s dN/dy for the top 5% centrality. Download PDF Download PNG
Analyzer: Usman Ashraf, Tsinghua University
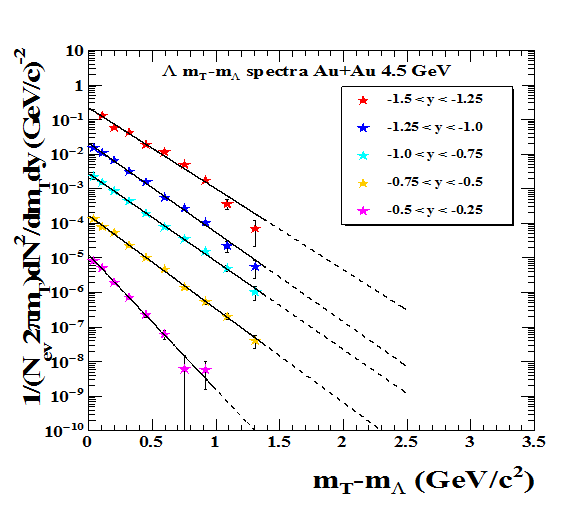
Plot: Lambda spectra for the top 5% centrality. Download PDF Download PNG
Analyzer: Usman Ashraf, Tsinghua University
Note: I do not have the original PDF version so I converted it and the resolution is not very good. Please contact Usman if you need a better resolution PDF version.
.png)
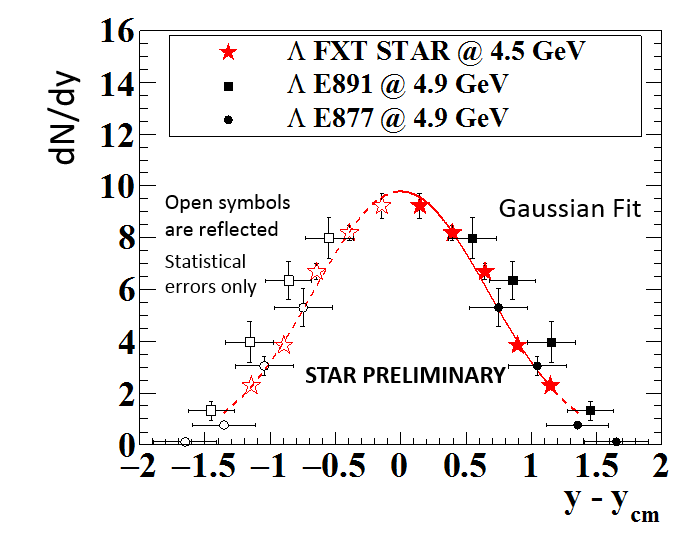
Plot: Lambda dN/dy for the top 5% centrality. Download PDF Download PNG
Analyzer: Usman Ashraf, Tsinghua University
Note: I do not have the original PDF version so I converted it and the resolution is not very good. Please contact Usman if you need a better resolution PDF version.
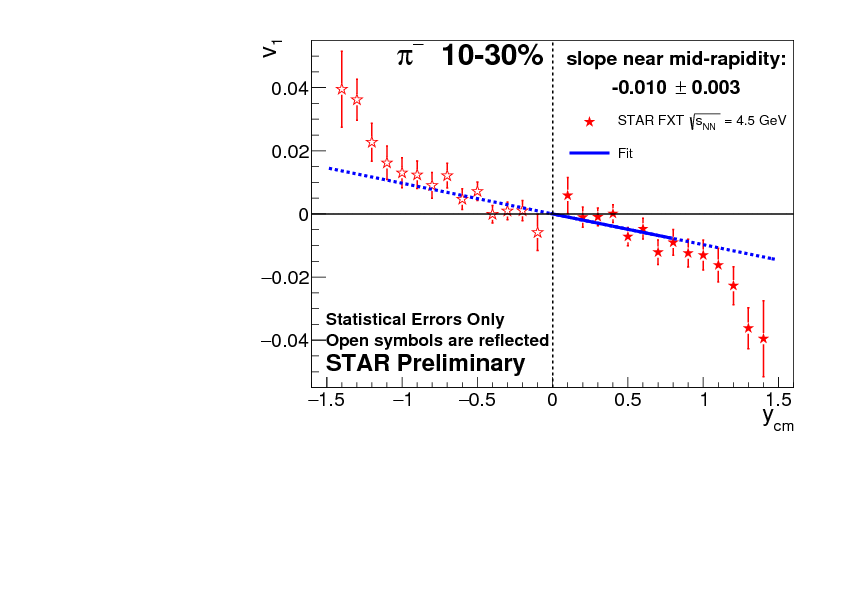
Plot: Pi minus dv1/dy Download PDF
Analyzer: Yang Wu, Kent State University
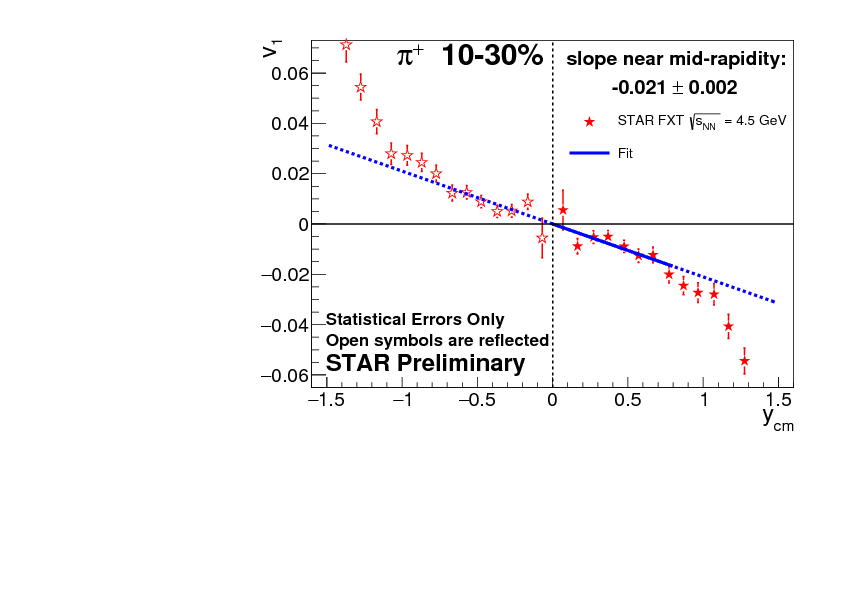
Plot: Pi plus dv1/dy Download PDF
Analyzer: Yang Wu, Kent State University
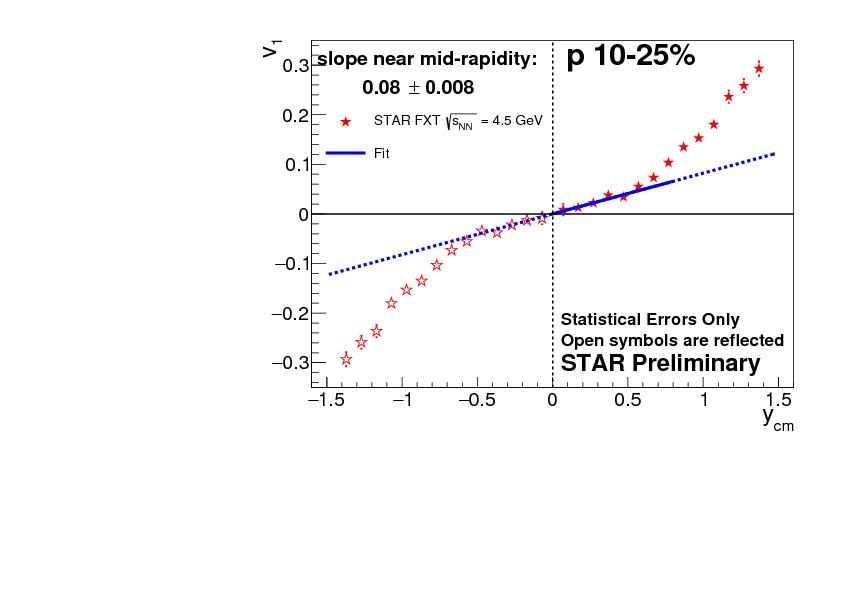
Plot: Proton dv1/dy Download PDF
Analyzer: Yang Wu, Kent State University
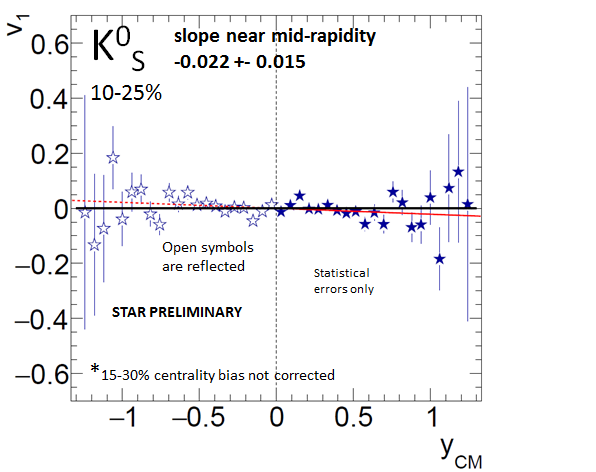
Plot: K0s dv1/dy Download PDF
Analyzer: David Tlusty, Rice University
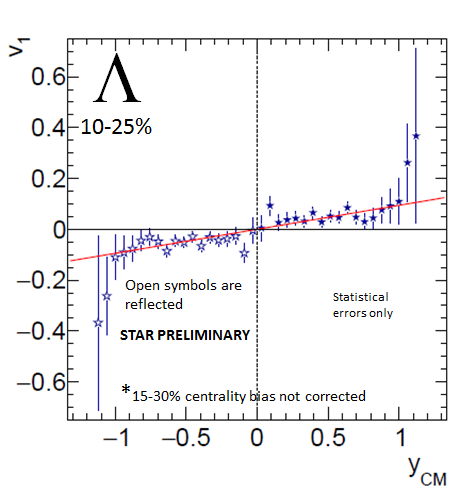
Plot: Lambda dv1/dy Download PDF
Analyzer: David Tlusty, Rice University
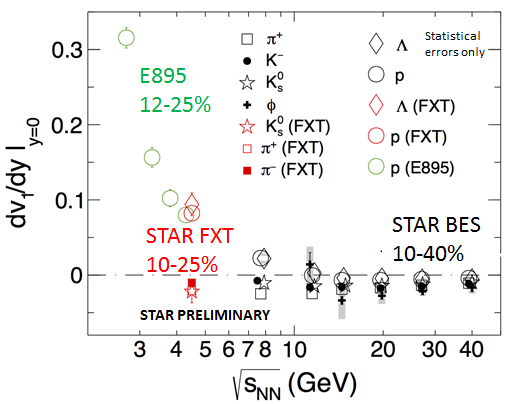
Plot: Comparison of directed flow with world data Download PDF
Analyzer: David Tlusty (plotmaker), Rice University, Yang Wu, Kent State University
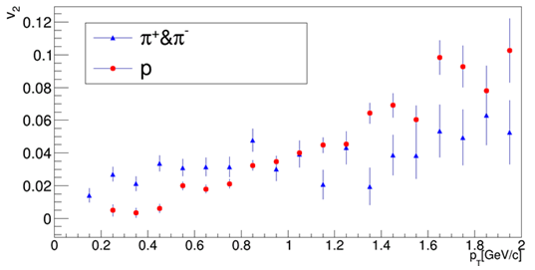
Plot: Pion and proton v2 Download PDF
Analyzer: Lukasz Kozyra, Warsaw University of Technology
Note: I never received a PDF version of this exact plot so the quality of the conversion is bad, but there is also pdf of this plot with the E895 proton data (Download PDF). This latter plot hasn't been shown outside STAR in this exact form, but all the data it contains has been shown outside STAR in other plots.
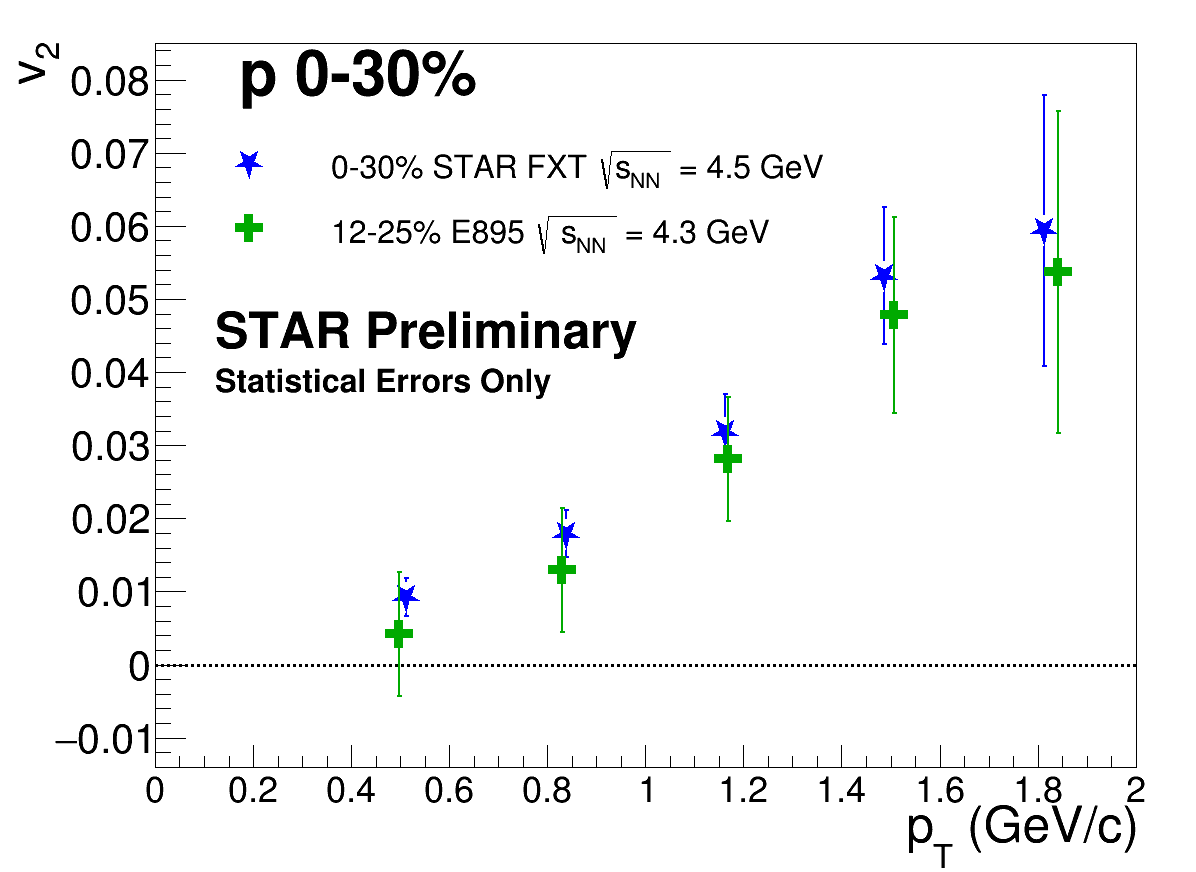
Plot: Comparison between STAR and E895 proton v2 Download PDF
Analyzer: Lukasz Kozyra, Warsaw University of Technology
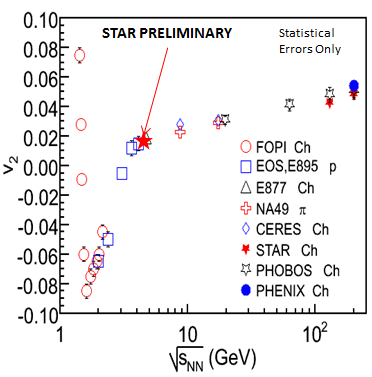
Plot: Comparison of charged v2 with world data Download PDF
Analyzer: Lukasz Kozyra, Warsaw University of Technology
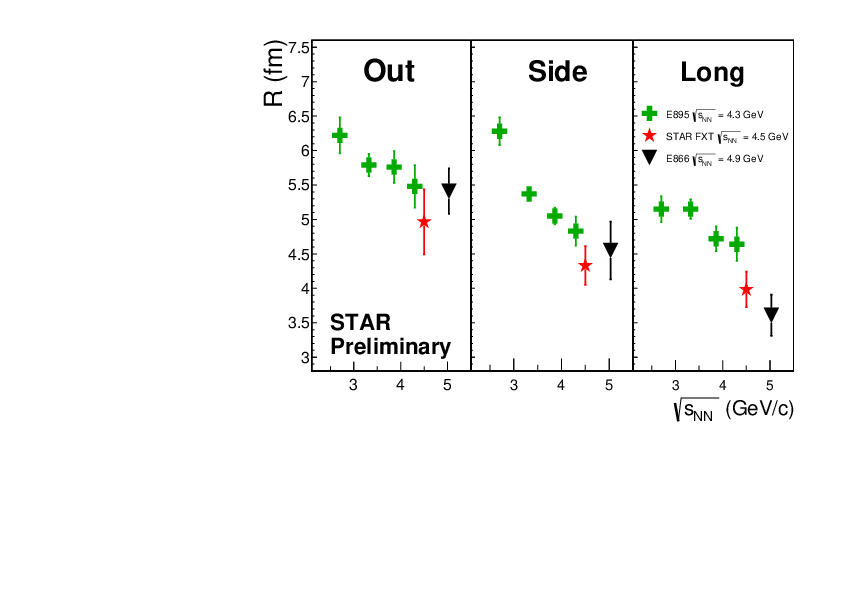
Plot: Comparison of STAR HBT radii with E895 and E866 Download PDF
Analyzer: John Campbell, Ohio State University
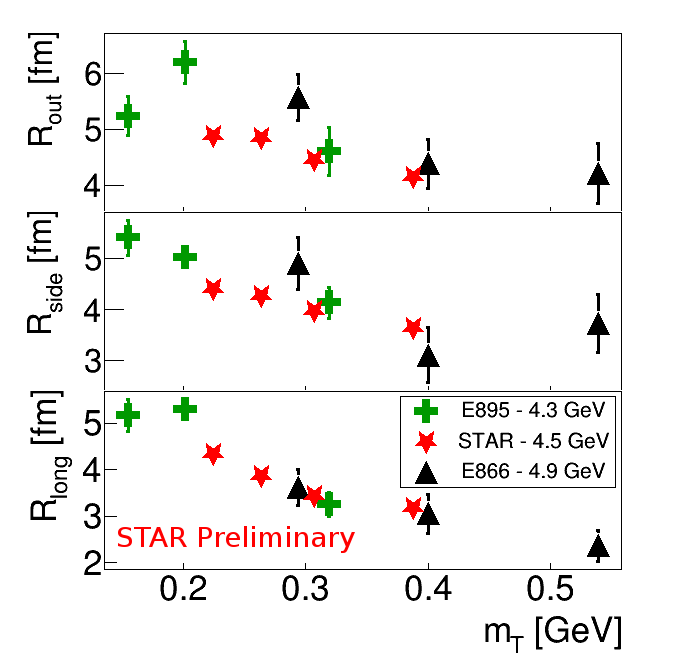
Plot: Comparison of transverse mass dependence of STAR HBT radii with E895 and E866 Download PDF
Analyzer: John Campbell, Ohio State University
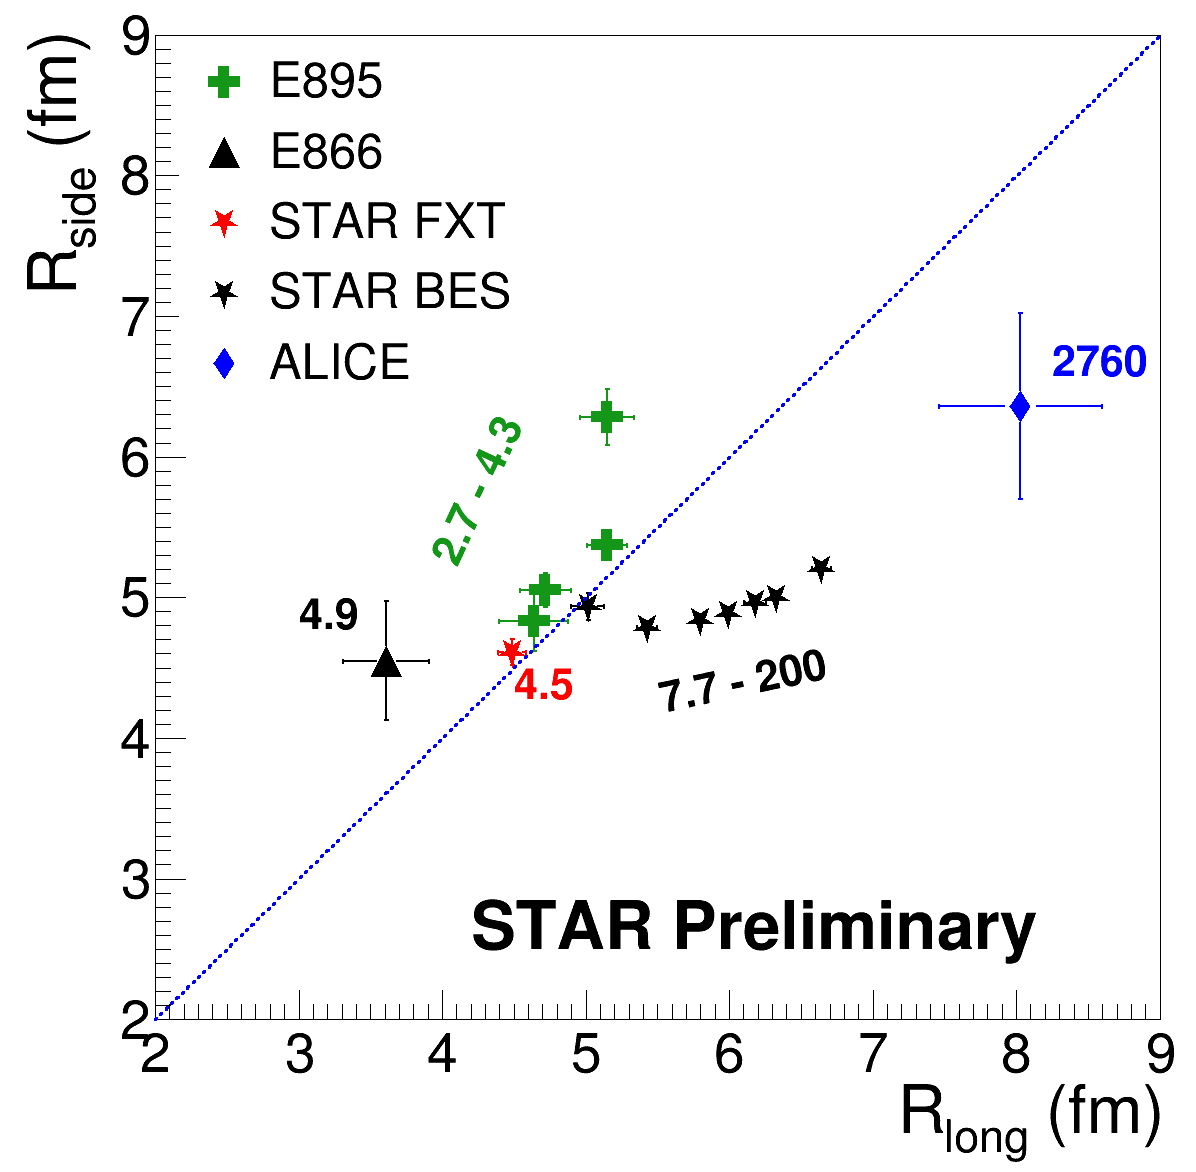
Plot: Comparison of Rside vs Rlong with world data Download PDF
Analyzer: John Campbell, Ohio State University
Terry Tarnowsky also had a dynamical fluctuations plot presented in this Quark Matter talk but since he is publishing separately I imagine he will want his own preliminary plots page.
- kmeehan's blog
- Login or register to post comments