Electron identification efficiency
The electron identificatione fficiency is calculated to determine how effective the electron identification process done in this analysis is, and hence how much electrons there actually are, given what is observed.
To put it simply,
efficiency = identified electrons / embedded electrons
The process of identifying reconstructed tracks is covered here.
There are various efficiencies calculated for various steps in the electron identifaction process. The efficiencies are also studied as a function of various parameters, VZ, pT, eta, phi, and EMC eta.
- TPC reconstruction efficiency: TPC reconstructed electrons* / embedded MC electrons (*these electron tracks need to satisfy the various primary tracks quality cuts)
- EMC-matching efficiency: EMC-matched electrons / TPC reconstructed electrons
- SMD cut efficiency: EMC-matched electrons that satisfy SMD cut / EMC-matched electrons
- p/E cut efficiency: EMC-matched electrons that satisfy p/E and SMD cuts / EMC-matched electrons that satisfy SMD cut
- dE/dx cut efficiency: is not calculated using simulation, but rather by fitting the dE/dx distribution of real data
Results for 2005 shown, 2006 efficiency still in progress.
.png)
The >1 primary track reconstruction efficiency is due to the difference in mc track pT and reconstructed pT. This issue still needs a closer look.
Efficiency vs VZ with 3 sets of eta cut
.png)
The TPC sector boundaries are clearly visible here. The effect is more pronounced for higher pT tracks. The EMC status clearly comes into play past the track-point matching stage.
Efficiency as a function of phi is consistent between the three different VZ and eta cuts.
.png)
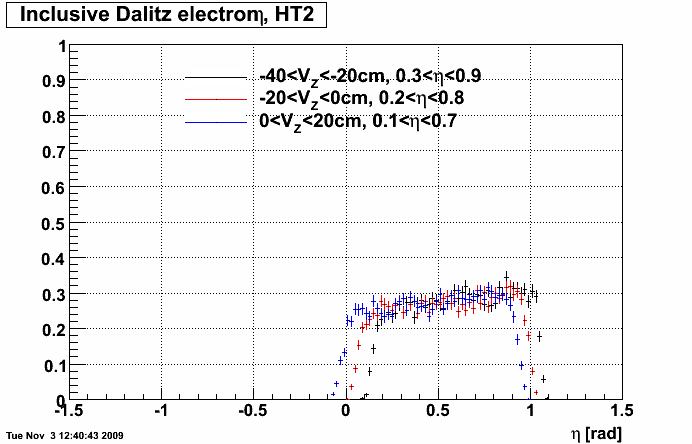
The asymmetry is clearly due to the fact that only the west barrel was used for 2005. There's significant drop in efficiency due to the edges of the EMC. To avoid having to make a significant eta cut, different eta cuts are applied for different VZ regions, as that allows more statistics while at the same time keeping a relatively 'flat' efficiency in eta.

.png)
The efficiency calculcated here takes into account the acceptance of the detector. Since the acceptance varies over time, the efficiency needs to be calculated with detector (BEMC in particular) status that is most representative of the entire run by setting a time stamp (for the simulation data analysis) that corresponds to such a status. BEMC status over time was studied, and a status table chosen for the simulation analysis.
Selecting 2005 BEMC status table
Similar study will be done for 2006. Time regions with significantly different acceptance and BEMC status can (and probably will be) corrected at a later date.
- kurnadi's blog
- Login or register to post comments

.png)