dE/dx cut, efficiency and electron purity
One of the electron id cut is the dE/dx cut. Unlike the other cuts, the efficiency of this cut is calculated from data instead of simulation. During the same process, the purity of the obtained electron sample is also calculated.
To determine the dE/dx cut, the dE/dx electron Nsigma distribution of primary tracks that satisfy all other electron id cuts is fitted with 3 Gaussians.
- The fit is done for 4 pT bins: 2-3GeV, 3-4GeV, 4-6GeV, >6GeV
- Mean and sigma of electron Gaussian is fixed whenever possible (fit wasn't giving a very physical result for 4-6GeV when these were fixed).
- The 3 Gaussian is roughly interpreted as protons and Kaons, pi0s, and electrons.
The procedure is the same for 2005 and 2006 data. Shown below is the results for 2005.
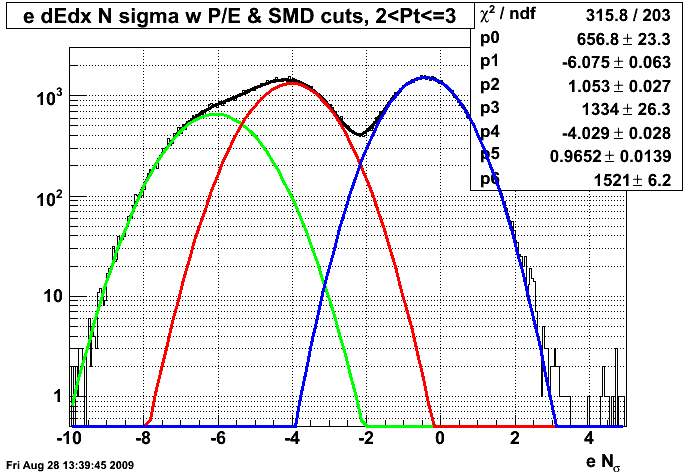

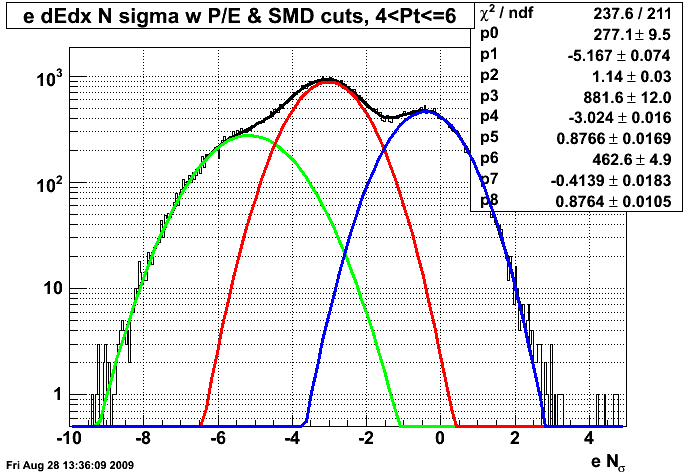
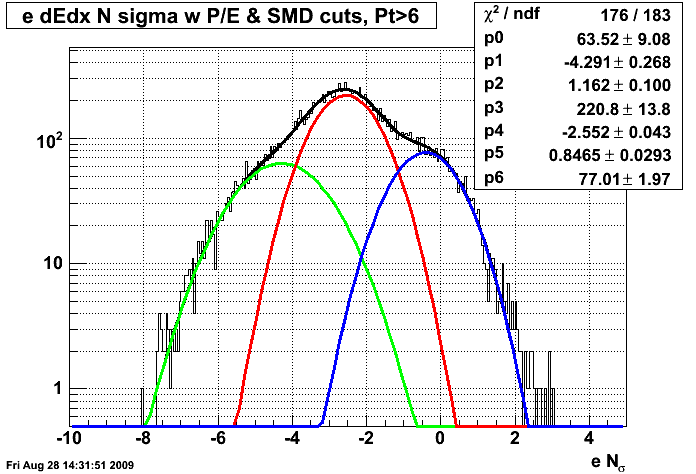
After the distribution is fitted, the fit results are used to calculate the efficiency of the cut and purity of the sample for differing lower cuts. The dE/dx upper cut is set to Nsigma = 3. The calculation for the two is as follows:
Efficiency: Number of tracks passing the cut (integral from lower end cut to 3) / Integral of electron Gaussian (+/- 5 sigma)
Purity: Integral of electron Gaussian in cut range (lower cut to 3) / sum of all three Gaussian integrals within cut range (lower cut to 3).
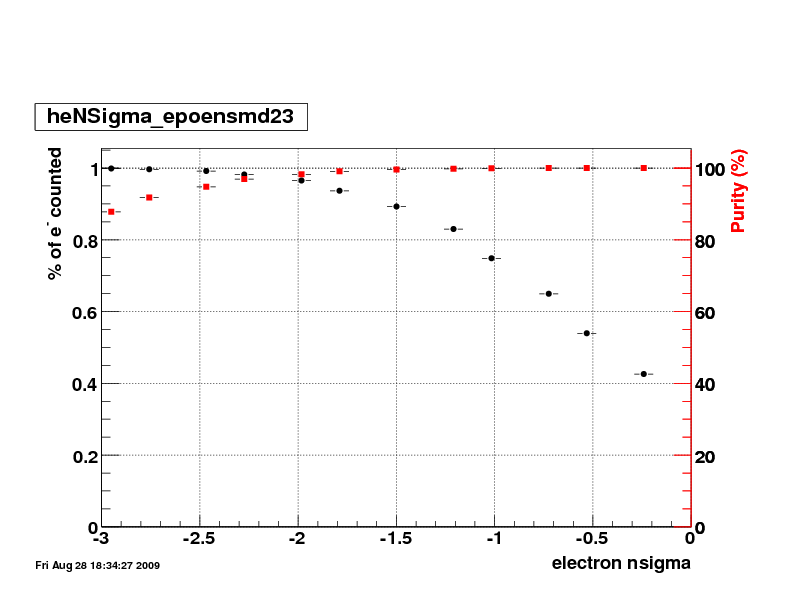

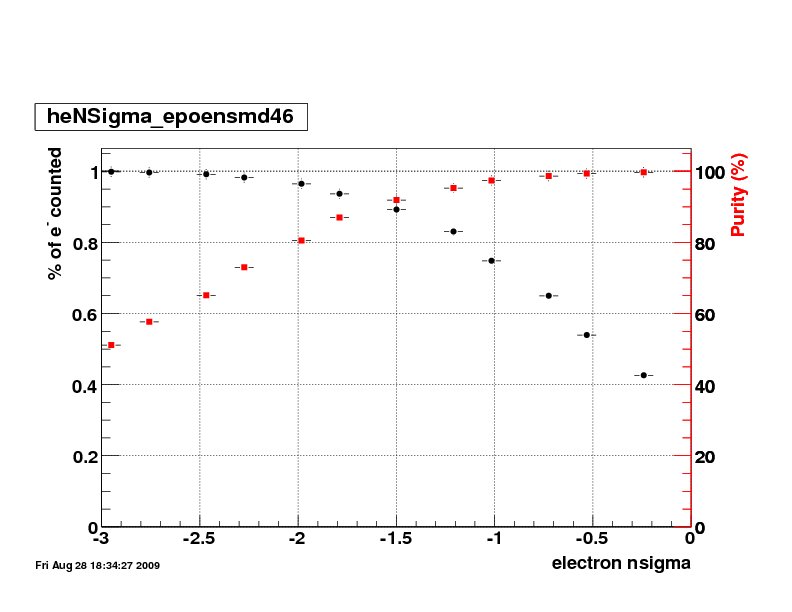
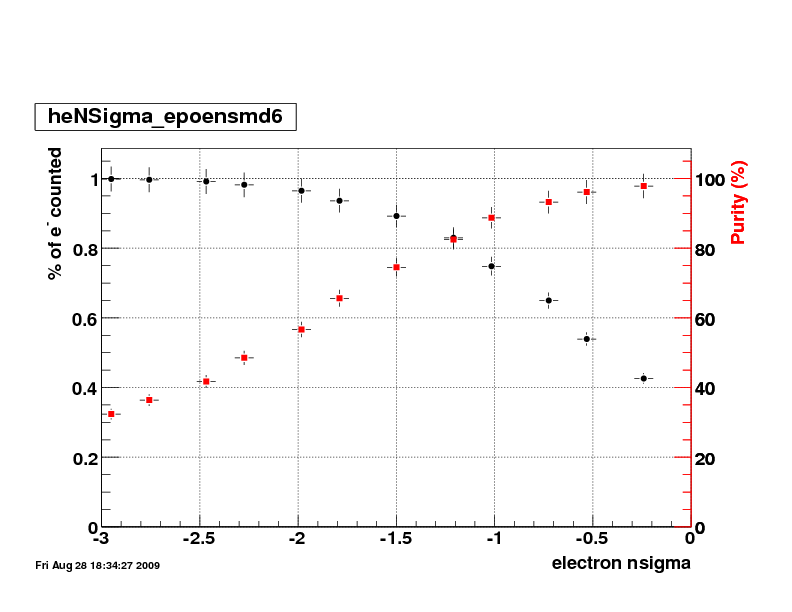
Based on the calculated efficiency and purity, the cuts are chosen to try to maximize both. To keep electron purity above 90%, the following lower cuts were chosen:
2005:
|
pT range |
lower e nsigma | purity | efficiency |
| (2,3]GeV | -2.5 | 94.8% | 99.1% |
| (3,4]GeV | -2 | 93.5% | 96.5% |
| (4,6]GeV | -1.5 | 91.9% | 89.2% |
| (6,20]GeV | -.75 | 93.2% | 64.9% |
2006:
|
pT range |
lower e nsigma | purity | efficiency |
| (2,3]GeV | -2.5 | 92.4% | 99.4% |
| (3,4]GeV | -2 | 92.5% | 97.4% |
| (4,6]GeV | -1.5 | 91.7% | 91.6% |
| (6,20]GeV | -.5 | 92.3% | 60.5% |
- kurnadi's blog
- Login or register to post comments
