- leun's home page
- Posts
- 2013
- 2012
- December (2)
- October (3)
- September (2)
- August (1)
- July (4)
- June (4)
- May (2)
- April (3)
- March (5)
- February (5)
- January (5)
- 2011
- December (3)
- November (3)
- September (5)
- August (2)
- July (2)
- June (3)
- May (4)
- April (4)
- March (2)
- February (4)
- January (2)
- 2010
- December (2)
- November (3)
- October (3)
- September (5)
- August (6)
- July (2)
- June (4)
- May (3)
- April (4)
- March (4)
- February (2)
- January (4)
- 2009
- 2008
- October (1)
- My blog
- Post new blog entry
- All blogs
20091204 Full Pythia-GSTAR Pilot Run
Full Pythia-GSTAR Pilot Run
So far we have only studied single species, flat distribution of particles processed through GSTAR. In order to gauge the usefulness of full Pythia + GSTAR simulation, we've run a pilot run with the following conditions.
1. Default processes for pp collision defined by Pythia 6. 416 (MSEL=1) with no explicit minimum pT limit (ckin3=0) were used. No diffractive interactions were included.
11 f + f' -> f + f' (QCD)
12 f + fbar -> f' + fbar'
13 f + fbar -> g + g
28 f + g -> f + g
53 g + g -> f + fbar
68 g + g -> g + g
95 Low-pT scattering
Resulting cross-section is ~27.6mb.
2. Only East South FPD was passed onto GSTAR, with pythia filter set at Esum(ES)>33GeV or (Esum(EN)>18GeV && Esum(ES)>18GeV), including hadron energy. The resulting filter rate was ~0.8%.
3. Total 300M pythia events were simulated, which is ~11/nb. About 25M events were passed to GSTAR. After GSTAR with Esum(ES)>20GeV filter, ~250,000 events were stored for reconstruction.
4. As before, FPD was positioned in the "middle" position, ~30.7cm away from the beam.
This page contains a few plots from this pilot run. Some of them don't have enough statistics to be meaningful, but they are there as place holders. It will be updated as more statistics are added.
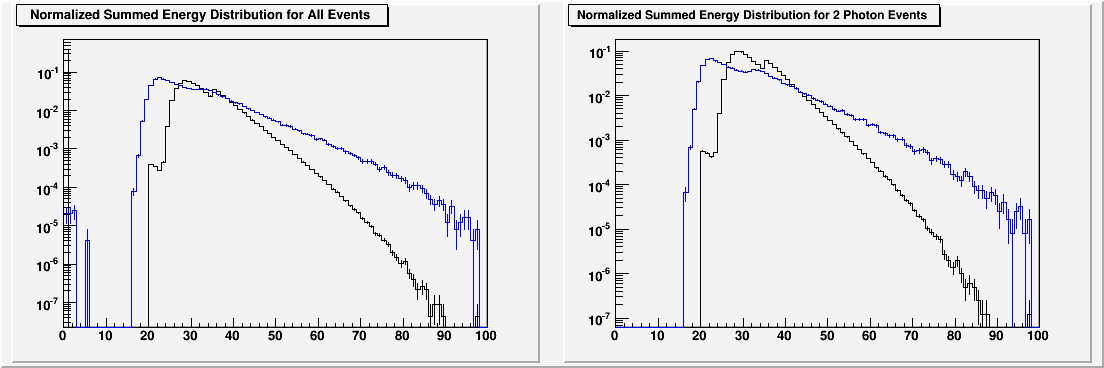
Fig. 1. East South Detector Summed Energy distribution for Run6T data (Black) and Pythia+GSTAR(Blue), normalized to 1.

Apparently, Pythia grossly overestimates the cross-section at high xF. It is at the moment not clear if this is a known feature of Pythia, or I'm simply doing something incorrectly.
On the other hand, it does better in reproducing the invariant mass spectrum. The following plots show Mgg distribution (no Zgg or fiducial cut) in energy bins, with data in Black, Pythia in Blue, and Pythia minus hits from Eta decays in Magenta.
Fig. 2a. Normalized Mgg distribution in log scale

Fig. 2b. Normalized Mgg distribution in linear scale

Now we try the usual center cut with Eta^2 + tan(Phi)^2 < 0.15^2, again in energy bins in log and linear scale with no other cut.
Fig. 3a. Normalized Mgg distribution with center cut in log scale

Fig. 3b. Normalized Mgg distribution with center cut in linear scale

Keeping these in mind, here is an early attempt at analyzing the shower shape from this simulation set.
- leun's blog
- Login or register to post comments
