- leun's home page
- Posts
- 2013
- 2012
- December (2)
- October (3)
- September (2)
- August (1)
- July (4)
- June (4)
- May (2)
- April (3)
- March (5)
- February (5)
- January (5)
- 2011
- December (3)
- November (3)
- September (5)
- August (2)
- July (2)
- June (3)
- May (4)
- April (4)
- March (2)
- February (4)
- January (2)
- 2010
- December (2)
- November (3)
- October (3)
- September (5)
- August (6)
- July (2)
- June (4)
- May (3)
- April (4)
- March (4)
- February (2)
- January (4)
- 2009
- 2008
- October (1)
- My blog
- Post new blog entry
- All blogs
run10138049
Run 10138049 (5/18)
The first 700,000 events from this run are analyzed. Configuration was "production2009_200Gev_Single / Physics"
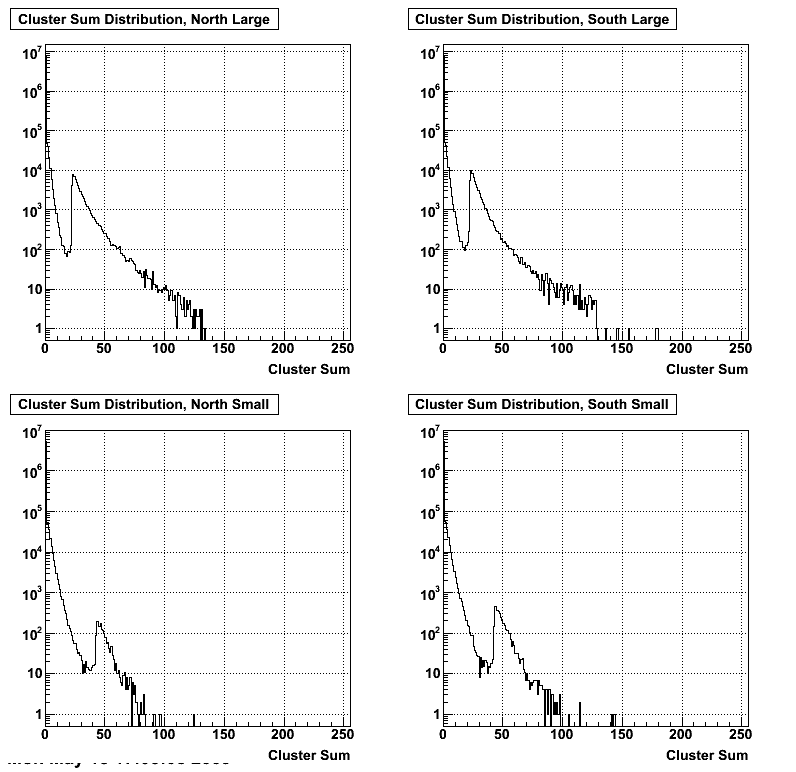
The clusters are generated from Qtdata. These clusters differ from the "appended/internal" L1 DSM input clusters in two aspects. 1. Qt8 sums are NOT truncated. 2. The perimeter high towers are ignored according to Eleanor's table.
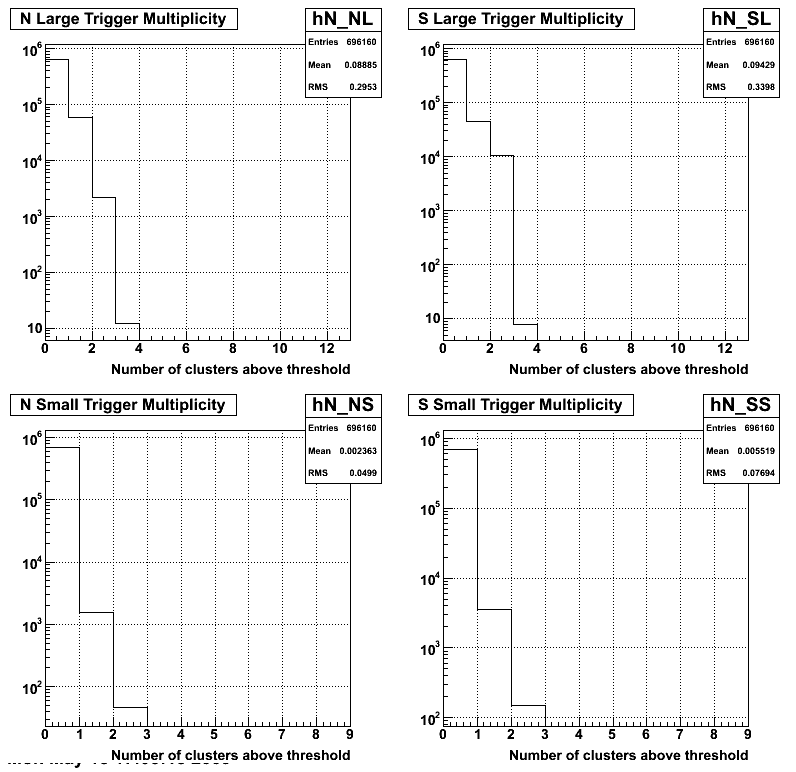
Total of 40 clusters, one for each Qt32 board, are compared to the threshold.
LED suppression is done by looking at the number of channels with ADC>10, and cutting at 800.
Number of trigger breakdown per module
North Large: Total 61855 triggers, top 5 cells produced 78% of the triggers. There is one cell, ch456, that generated over 43000 triggers.
South Large: Total 65639 triggers, top 5 cells produced 63% of the triggers. There is one cell, ch282, that generated over 24000 triggers.
North Small: Total 1645 triggers, top 5 cells produced 35% of the triggers.
South Small: Total 3842 triggers, top 5 cells produced 36% of the triggers.
Overall, 96% of the trigger came from large cells.
For the following plots, the origin is South Up.
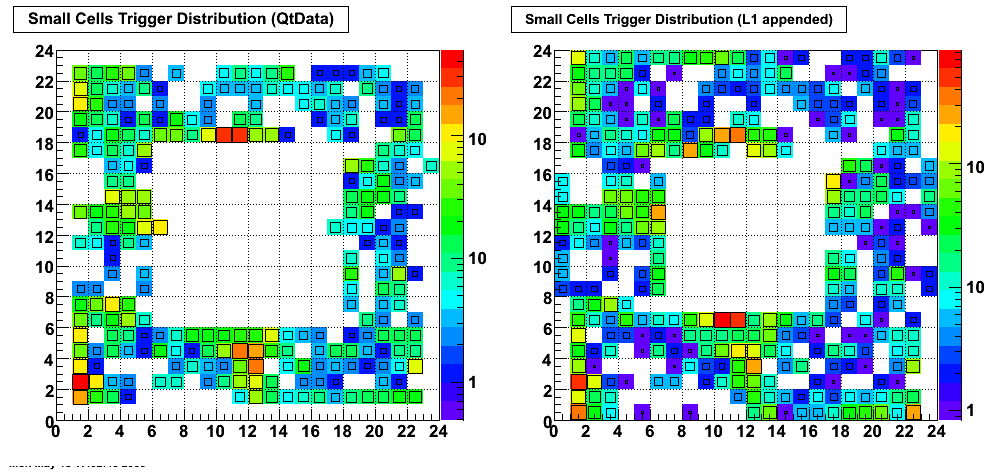
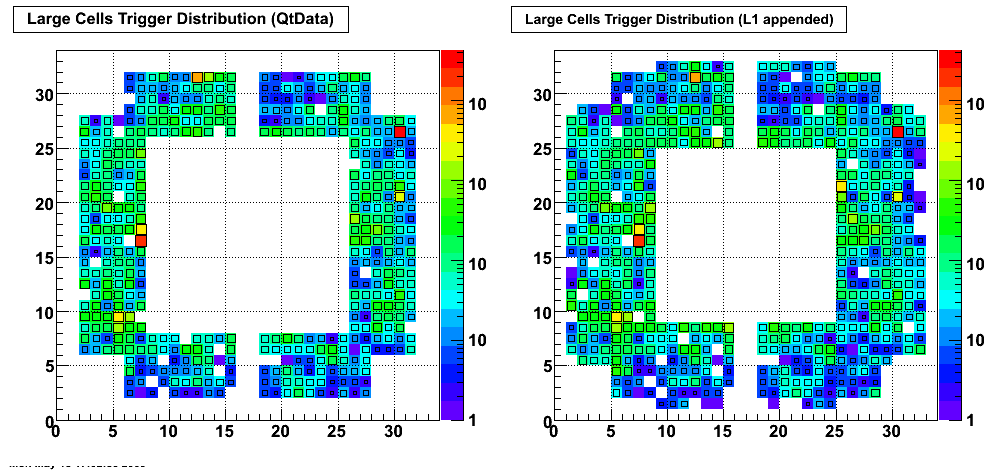
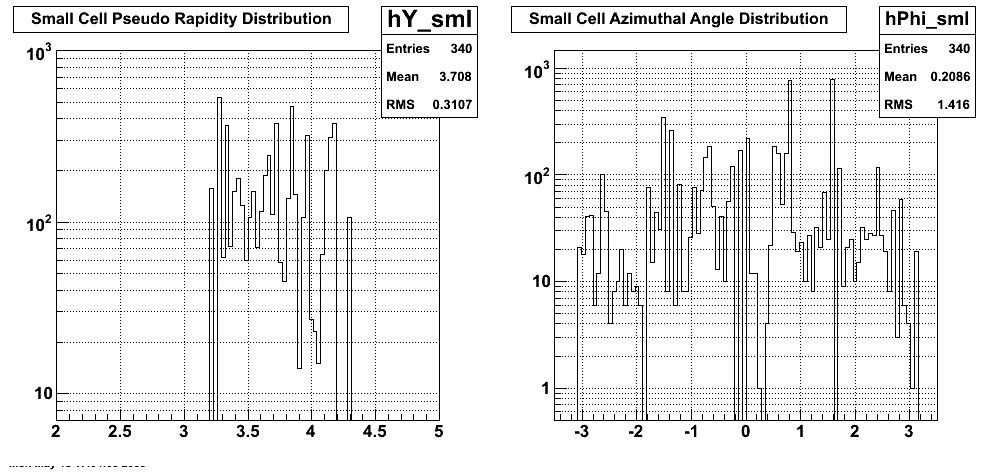
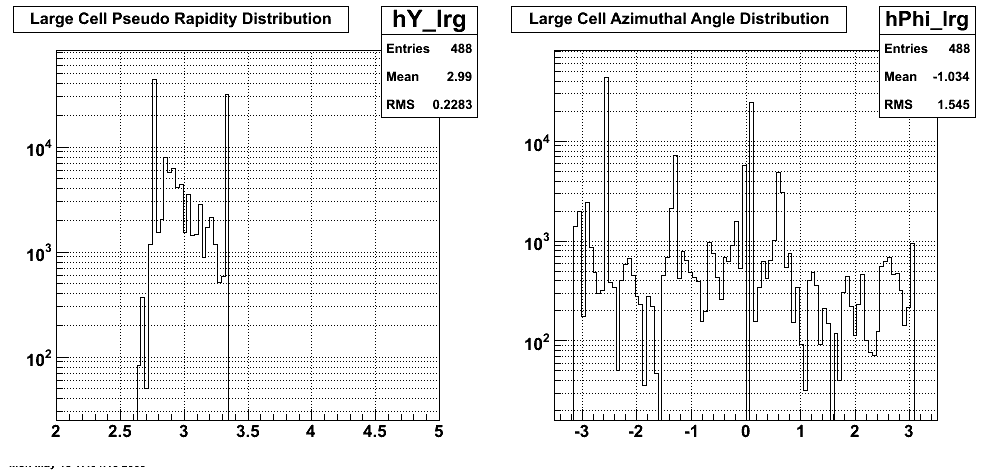
Cluster sum distribution. (after low 5 bit suppression)
Trigger multiplicity
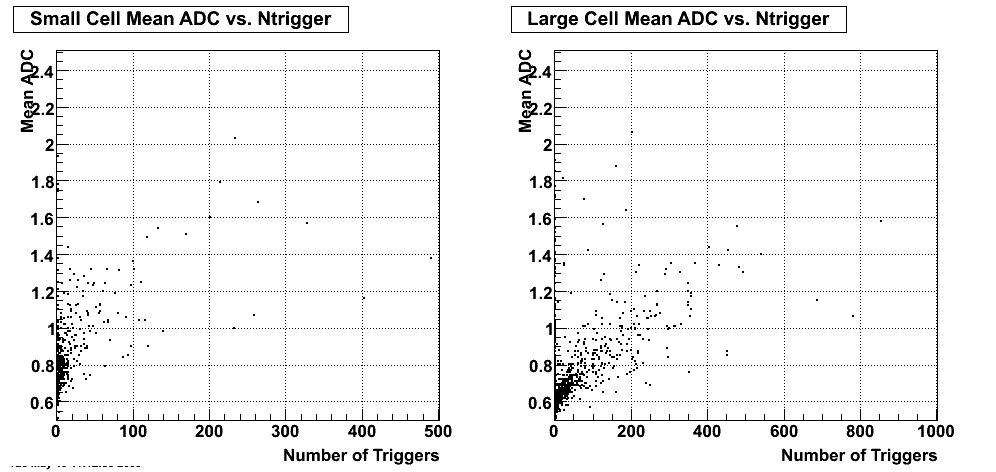
Attached spreadsheet shows number of triggers, pseudo-rapidity, and phi for each cell.
- leun's blog
- Login or register to post comments
