- leun's home page
- Posts
- 2013
- 2012
- December (2)
- October (3)
- September (2)
- August (1)
- July (4)
- June (4)
- May (2)
- April (3)
- March (5)
- February (5)
- January (5)
- 2011
- December (3)
- November (3)
- September (5)
- August (2)
- July (2)
- June (3)
- May (4)
- April (4)
- March (2)
- February (4)
- January (2)
- 2010
- December (2)
- November (3)
- October (3)
- September (5)
- August (6)
- July (2)
- June (4)
- May (3)
- April (4)
- March (4)
- February (2)
- January (4)
- 2009
- 2008
- October (1)
- My blog
- Post new blog entry
- All blogs
Run6 FPD Pi0 GSTAR
This page shows results from GSTAR simulation for run6 FPD at far position (configuration y2006g) with pi0s spread uniformly in selected momentum range. Geant function user/phasespace was used to spray the pi0s.
Here we focus on the issue of energy dependent gain correction.
Distribution of generated pi0s in FPD cell coordinates
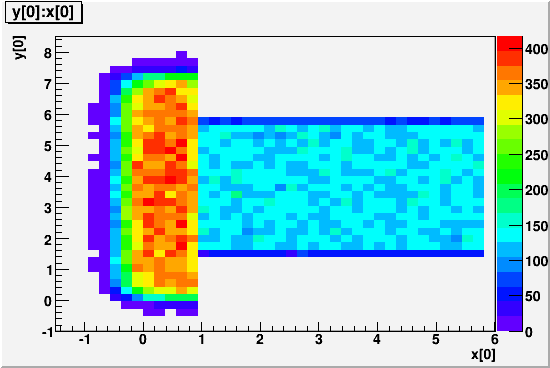
The reason for the funniness is because it was done in two stages. First pi0s were aimed only at the inner 5x5 matrix, and later more pi0s were added at the beam side edge to study the edge effect. A convinient divide is at x=1. From here on, anything referred to as "inner" correspond to the pi0s with x>1. "Edge" is for x<1.
We take a look at the energy dependent mass shift plot from run6 longitudinal data for the east FPD. This was with FPD at middle position. (xoffset~30cm)

What's being plotted is 0.135GeV/(Reconstructed Mass). So we see ~1% per 10GeV rise of the invariant mass as a function of the energy. This is fairly representative of this energy dependence we've seen with the east FPD through many different data set. 1~2% per 10GeV is normal for FPD.
INNER EVENTS
First, we look at the "inner" events where both photons landed in the central 5x5.
We see a (qualitatively) very similar energy dependence in GSTAR as well.
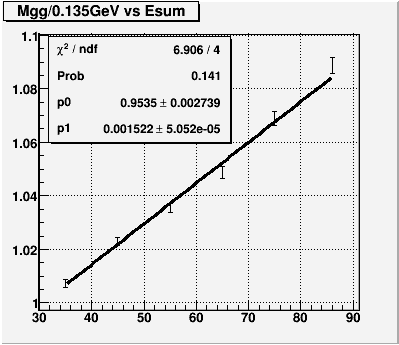
Here what's being ploted is reciprocal of the previous plot, but that doesn't really change the rate. We are seeing ~1.5% per 10GeV increase in invariant mass, which is qualitatively consistent with what we see in data, albeit in much wider energy range.
Usually in FPD analysis, once we identify the shift in invariant mass as a function of summed energy, we correct the summed energy with equal and opposite factor to take out the energy dependence.
Looking at the usual formula for calculating the invariant mass for two photon decay.
where Zgg is the energy sharing, and for small angles sin(Theta/2) ~ Dgg/2, where Dgg is the two photon separation.
The implicit assumption in the energy dependent gain correction is that the error in Mgg is due to the error in our measurement of energy. This is of course not obvious, since mis-measurement can also come in with the energy sharing or the separation, or any combination of the three independent variables.
While we can't be sure that the energy dependence we see in the simulation is essentially the same effect as what we see in the data, it is nonetheless interesting to see what the cause of this effect is at least in simulation.

Summed energy/Thrown energy ratio shows the least dependence in energy, with ~0.03% drop per 10GeV. The energy sharing term shows ~0.18% drop per 10GeV, still an order of magnitude down from what we see with invariant mass. Only separation shows energy dependence with the right direction and magnitude to cause the shift in invariant mass, with ~1.9% increase per 10GeV.
Apparently, as the two photons come together at higher energy, the reconstruction tends to systematically OVERESTIMATE the separation.
Looking at this effect in a little more detail, we plot reconstructed/generated separation versus the X-Y decay plane angle. This angle uses the same convention as in the single photon simulation. 0 corresponds to the horizontal decay where the more energetic photon is further away from the beam. +pi/2 corresponds to the vertical decay where the more energetic photon is higher up.
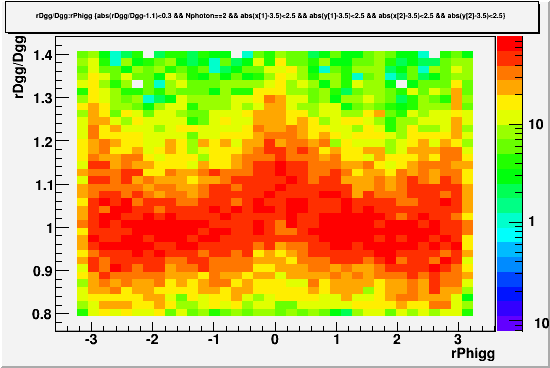
Here, we clrealy see a horizontal enhancement. That is, separation is the most likely to be overestimated in the case of horizontal decays. This suggests that the incident angle, which in this case is the largest among all previous FPD positions, may play a role in the measured energy dependence.
VERTICAL DECAYS (INNER)
Just for fun, here is the energy dependence of the invariant mass when I select for decays that are +-30 degrees from the vertical.
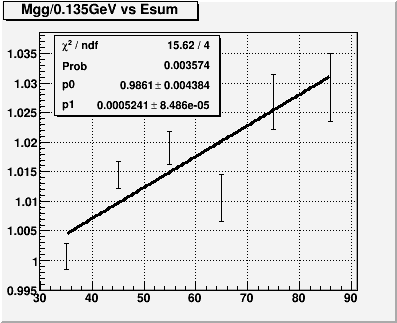
Now we see the slope is reduced by a factor of 3, at ~0.5% per 10GeV
The same three panel plots for energy, Zgg, and Dgg
.gif)
The separation slope is reduced by a factor of 2 now, at ~1% per 10GeV. This is still greater than the invariant mass slope, and I'm not sure why. But at any rate, it is interesting that at least in the simulation, the energy dependence has a very noticeable decay plane dependence. It is worth checking for the same effect with the real data.
EDGE EVENTS
So far all the plots were from the INNER events, where both photons land in the central 5x5. The following are the equivelant plots for the EDGE events, where generated x coordinate is smaller than 1. (The hot side edge events) There is also a fiducial volume cut, requiring the reconstructed positions of both photons be wihtin 0.5 cell away from the edge.
Energy dependence of invariant mass for EDGE events
.gif)
And once again the three panel plots for Esum, Zgg, and Dgg
.gif)
So for edge events, the energy dependence of invariant mass is reduced by just about a factor of 2. The separation ratio is also somewhat reduced down to ~1.4% per 10GeV, but again it's quite a lot larger than the invariant mass slope. What remains true is that the summed energy and the energy sharing term do not show enough dependence on energy to explain the shift in invariant mass.
a link to Greg's old (2004?) webpage on FPD association analysis
PROJECTIVE GEOMETRY
Here the EN FPD was tilted ~4.5 degrees inward to make the center of the detector projective. We look at the INNER events, with the same definition as before, and compare it to the non-projective, normal geometry. Two differences from the previous plots are,
1. Finer binning in energy including lower energy (E~25GeV) events
2. Zgg<0.7 cut
Energy dependence of invariant mass, comparison

Esum, Zgg, and Dgg for NORMAL geometry
Esum, Zgg, and Dgg for PROJECTIVE geometry

The change in geometry reduces the energy dependence from ~1.6%/10GeV to ~0.7%/10GeV, but it does not completely remove it. Looking at the three panel plots, even with projective geometry, it is still true that the separation mis-measurement is the driving force behind the energy dependence. But It is also reduced from ~2.6%/10GeV to ~1.6%/10GeV for above 35GeV. There seems to be something else going on at lower energy. In any case, the energy efficiency remains a very flat function of energy.
With normal geometry, we saw a decay angle dependence of the separation measurement. There was a tendency for overestimation for horizontal decays, which lead us to suspect incident angle as the culprit. With the incident angle largely removed from the picture, some energy dependence still remains. We compare the decay angle dependence of the separation measurement for two cases.
With the projective geometry, the peaks at horizontal angles (0 and +-pi) are largely gone. But there still remains more subtle structure, that seems to lower the ratio for diagonal decays compared to vertical or horizontal decays. We know that for two photon clusters, the amount of information available for the reconstruction is generally greater for diagonal decays. But we don't yet understand how the reconstruction deals with that difference. This point needs further investigation.
If we only select the diagonal decays and plot the usual things,
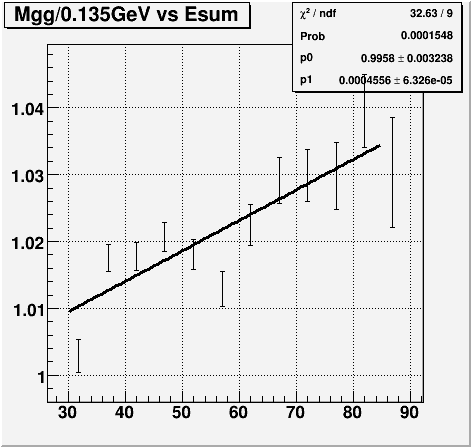

We see a much reduced energy dependence overall, with some funny structure. Furthermore, looking at the separation plot, it is almost flat up to ~55GeV.
Link to a page on run6 transverse data analysis
- leun's blog
- Login or register to post comments


