- leun's home page
- Posts
- 2013
- 2012
- December (2)
- October (3)
- September (2)
- August (1)
- July (4)
- June (4)
- May (2)
- April (3)
- March (5)
- February (5)
- January (5)
- 2011
- December (3)
- November (3)
- September (5)
- August (2)
- July (2)
- June (3)
- May (4)
- April (4)
- March (2)
- February (4)
- January (2)
- 2010
- December (2)
- November (3)
- October (3)
- September (5)
- August (6)
- July (2)
- June (4)
- May (3)
- April (4)
- March (4)
- February (2)
- January (4)
- 2009
- 2008
- October (1)
- My blog
- Post new blog entry
- All blogs
FMS meeting 20100426
Dgg vs. X: The Summary
We have found so far that in general, the two photon separation (Dgg) reconsturction tend to be much less accurate than the energy reconstruction, with various modes of error that depend on factors like the number of photons in a cluster and the two photon separation. In order to reduce these effects as much as we can, we have chosen to apply certain cuts when we calibrate. That is, we take only those two photon events that came from separate clusters, with the minimum separation of 2cells. This is in addition to the usual requirements of fiducial volume cut, Zgg<0.85, and E>30GeV.
With these cuts, the detector averaged separation looked good. But upon closer inspection, we found a structure in Dgg that apparently depended on the X coordinate of the photon.
Fig. 1
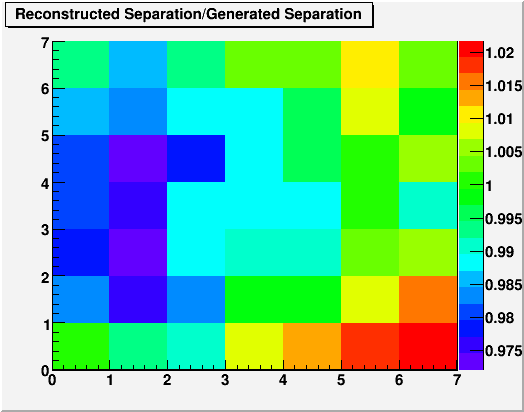
In short, the two photon separation for 30GeV pi0s gets underestimated near the beam and overestimated away from the beam. This is a problem for cell by cell calibration since the algorithm will compensate for these errors in Dgg with a matching errors in energy.
After spending weeks trying to figure out the causes of this effect, I have come to the following conclusions. I can't say that I understand all the pieces even now, but at this point I think I know enough to perform the calibration across the detector with reasonable uniformity.
1. Shower max position for run6 is deeper into the detector due to the absence of the pb converter plate.
Fig. 2
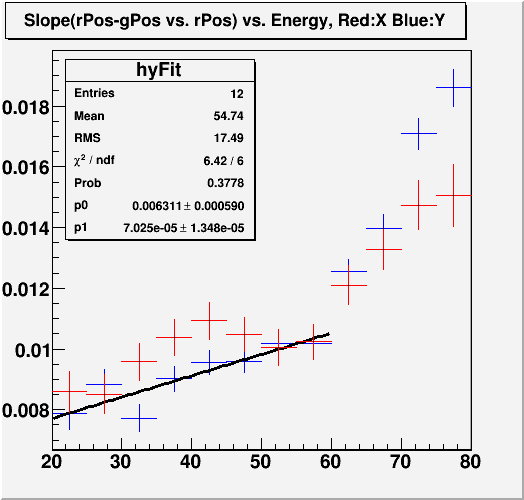
Here the Y axis can be interpreted as the % error in Z-position of the FPD, which was set at 809cm. We also see energy dependence, although the exact functional form is unclear. In principal, this energy dependence can cause X-coordinate shift as a function of energy, which in turn can cause the observed structure in Dgg(separation). However, the energy dependence is too weak for the magnitude we need to explain the structure, and indeed applying this correction doesn't do much to alleviate the symptom. In any case, for now I have set the Z-position to be ~6% greater than the previous value, which is conservative. More details on the shower max location can be found in this document.
2. Low energy photons (<10GeV) at the edge tend to reconstruct inward.
Apparently, for photons with energy less than ~10GeV that hit near the edge, there is a tendency for the reconstruction to put the photon further away from the edge than it really is.
Fig. 3
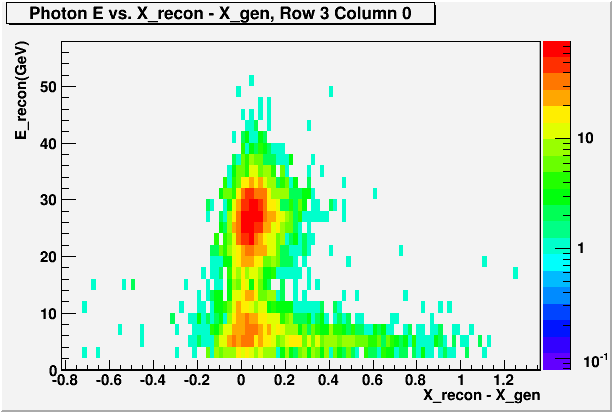
This ends up shifting the mean Delta-X up for the beam-side edge cells with respect to the inner cells.
Fig. 4
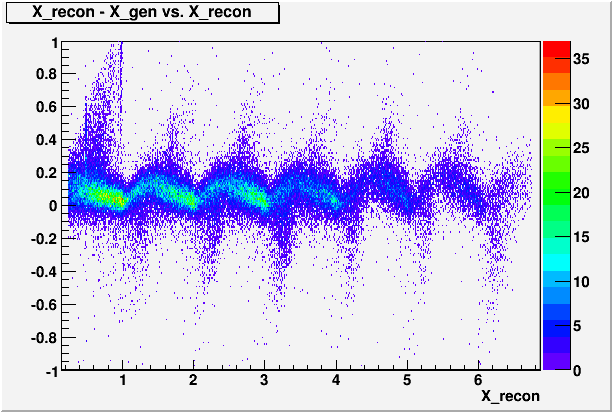
In the usual way that the calibration is done, the mass distributions for fitting are sorted by the position of the higher energy photon. Combined with the cross-section, the small photon is then more likely to be on the near side than the away side. This means that the 30GeV pi0 events that had the big photon in the first few columns tend to have the small photon on the beam-side edge.
Fig. 5
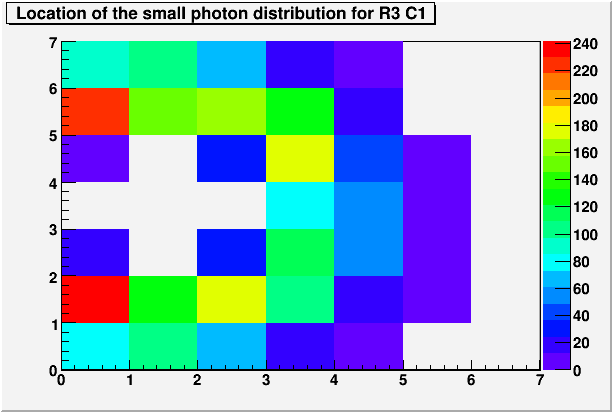
Fig. 6
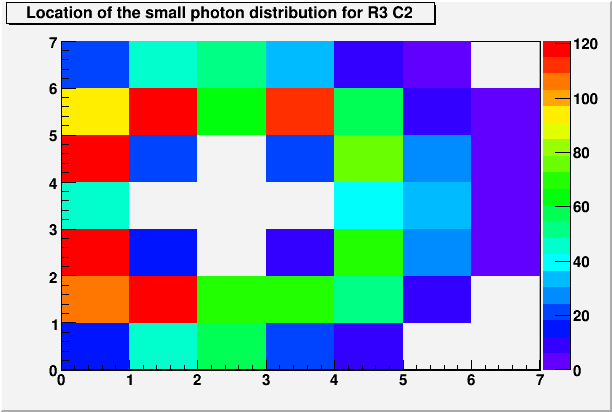
Because the small photon will reconstruct inward while the big photon will reconsturct more or less where it should, this effect can produce the observed pattern in Dgg vs X. Therefore, for the calibration, we add another cut that remove those events that had a photon with energy less than 10GeV in the very first column.
Fig. 7
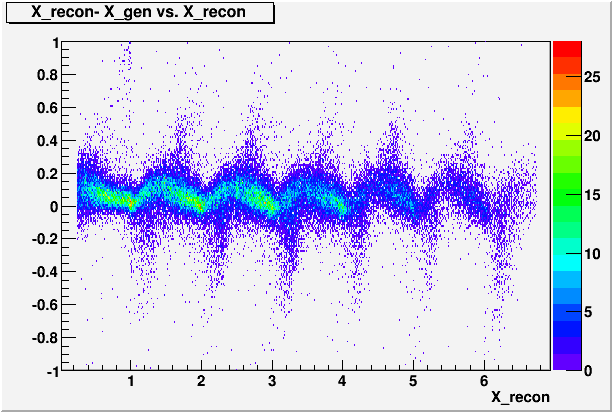
3. Delta X (X_recon - X_gen) vs. E
If we look at the correlation between the error in Dgg and the decay orientation angle Theta,
Theta = 0 : horizontal decay with higher energy photon further away from the beam
Theta = +-pi : horizontal decay with the higher energy photon closer to the beam
Fig. 8
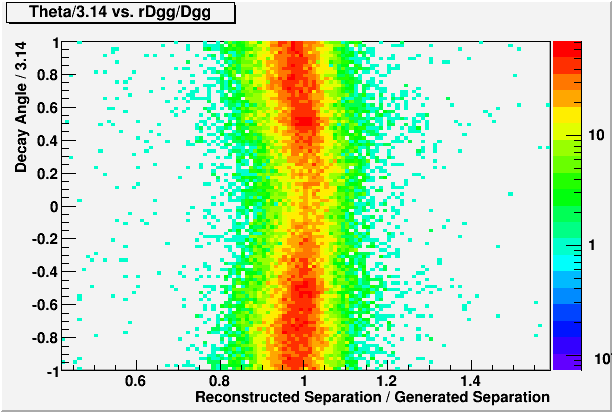
We see that Dgg gets overestimated for the horizontal decays with the big photon away from the beam, and underestimated for the horizontal decays with the big photon closer to the beam. Combined with the natural decay angle distribution as a function of the big photon X-position,
Fig. 9
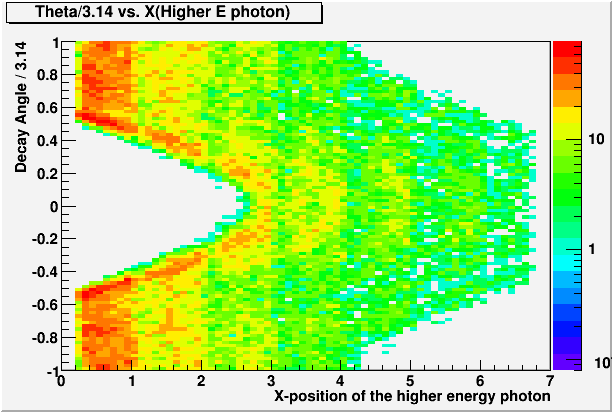
it's clear that this effect will also produce the observed structure in Dgg vs. X.
The cause of this correlation between the decay angle and Dgg seems to be the correlation between X-reconsturction and photon energy. That is, there is a tendency to overestimate the X-coordinate as the photon energy increases. This will increase Dgg in case the higher energy photon is further away from the beam, and decrease it in the opposite case. In short, it's Delta X vs. E effect.
Turns out, the effect is well simulated even for the single photon, flat-distribution GSTAR only simulation.
Fig. 10
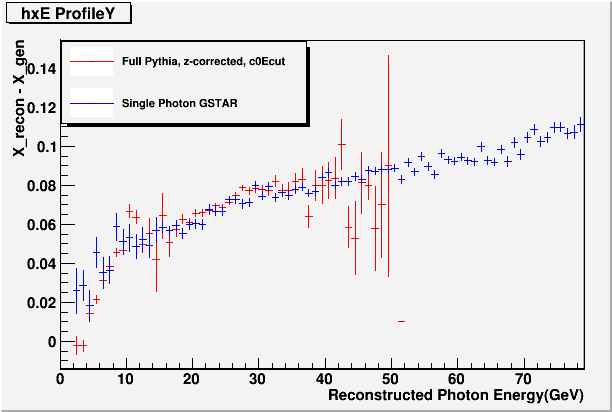
The exact cause of this effect remains unknown. However, we have a reasonable confidence in the simulation's ability to predict the features of photon by photon reconstruction, so I believe we can take this result and correct for the X-position for each photon.
Fig. 11
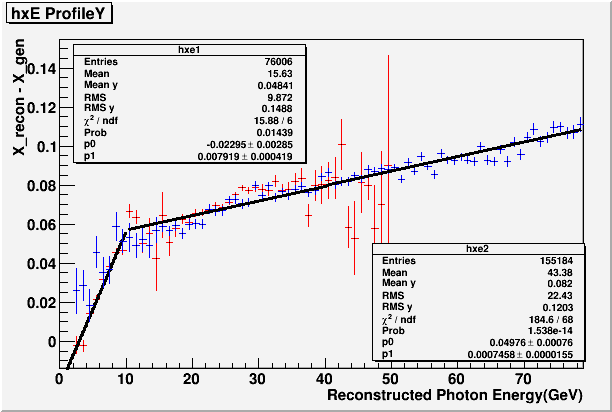
With all of the above corrections applied, we have the following result for Dgg vs. X.
Fig. 12
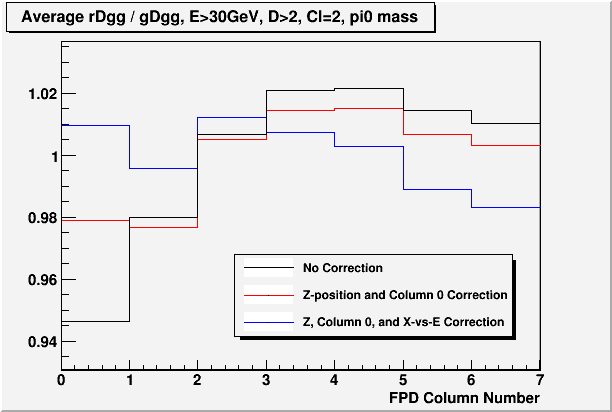
DISCLAIMER: These plots were made by doing projections and normalizing it to some constant. The only exact information here is the shape of each distribution, but the offset amonf the three should not be taken too seriously. On the other hand, the offset can be removed or tuned by calibration.
So we see that we still have some structure left, but at the all important beam side edge, we get a much flatter distribution than we did. I claim that this is close enough, and charge on with the calibration of both data and simulation.
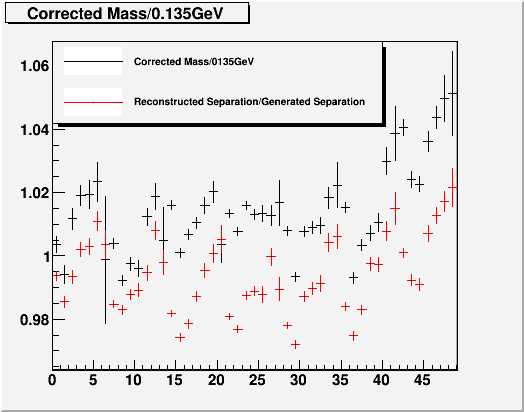
Originally, with no corrections, this is what the structure in Dgg and Mgg looked like as a function of FPD channels. This is with perfect gain, pedestal noise, and digitazation.
Fig. 13
With all the corrections applied, we get the following. (other conditions are the same)
Fig. 14
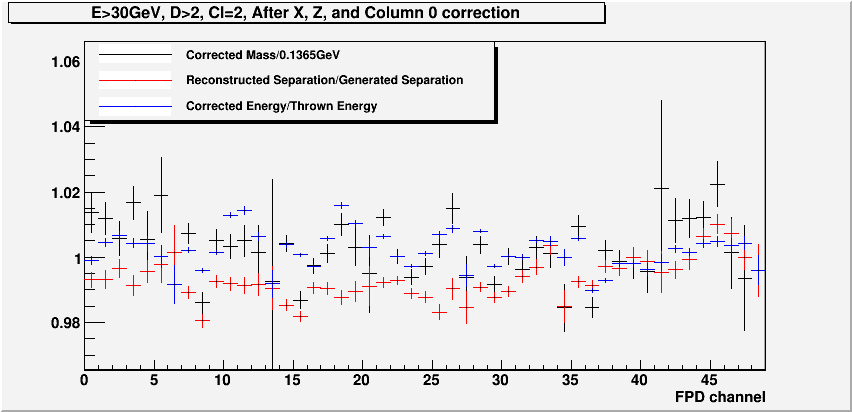
There are still some variations in mass, but they often times track the variations in energy, which means it can be taken out. The important point is that the Dgg distribution is limited to ~1% variation, which should really improve the Mgg based cell by cell calibration. The variation in energy seen here is likely to be coming from less-than-1-count pedestal variation, since these are mostly ~20GeV photons, and 1% in energy would correspond to roughly ~1 count in ADC.
The calibration for the data and simulation using these corrections are still under way. For the simulation, I added random 5% cell by cell gain variation. The goal is to apply the same calibration procedure as the data, and see how well the gain correction takes out the gain variation. After 2 iterations, we have the following result.
Fig. 15
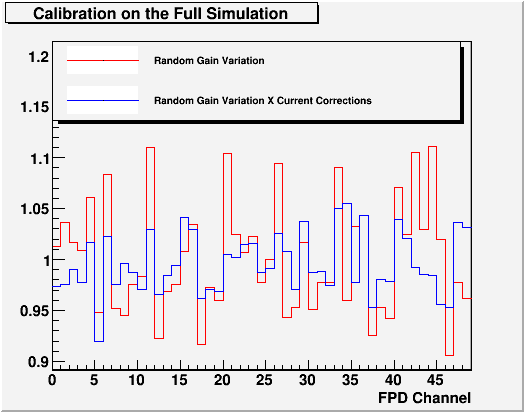
Clearly more iterations are needed, but so far it looks promising.
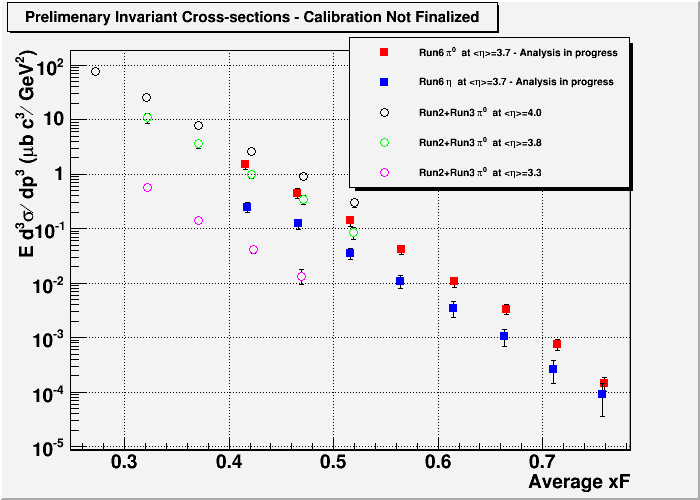
I have also done 2 iterations on the data with the new corrections, so it's also still moving around, but here is what the cross-section ROUGHLY looks like at this point. (some of the efficiency corrections are not up-to-date, so take this with a bottle of salt. I only want to demonstrate where the overall energy scale is right now)
Fig. 16
THE END
- leun's blog
- Login or register to post comments
