- leun's home page
- Posts
- 2013
- 2012
- December (2)
- October (3)
- September (2)
- August (1)
- July (4)
- June (4)
- May (2)
- April (3)
- March (5)
- February (5)
- January (5)
- 2011
- December (3)
- November (3)
- September (5)
- August (2)
- July (2)
- June (3)
- May (4)
- April (4)
- March (2)
- February (4)
- January (2)
- 2010
- December (2)
- November (3)
- October (3)
- September (5)
- August (6)
- July (2)
- June (4)
- May (3)
- April (4)
- March (4)
- February (2)
- January (4)
- 2009
- 2008
- October (1)
- My blog
- Post new blog entry
- All blogs
FMS meeting 20100802
Shower Shape Analysis
Since last week's post, I had a "duh" moment and realized that I didn't have to be guessing what the shower shape looks like in the simulation. I just needed to generate single photon events and look at the right kind of distribution to make direct comparison to the shower function in Yiqun.
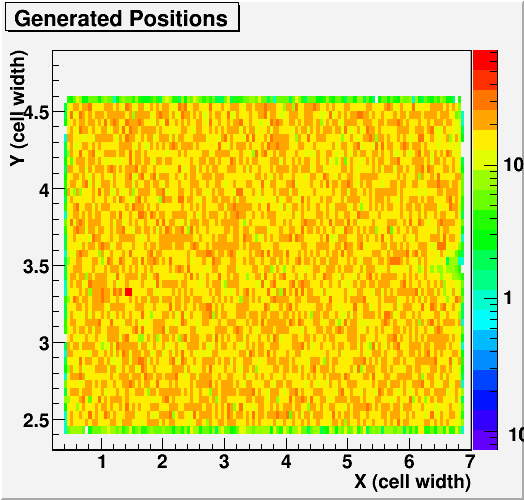
So I threw 100,000 ~30GeV photons at the FPD, confined to the center in the Y direction, (since we don't see any angle issue in Y) but spanning 5 inner cells in the X direction. I also have similar data set for 40 and 50GeV photons, but they have not been analyzed yet.
Fig. 1. Generated Distribution of 30GeV Photons
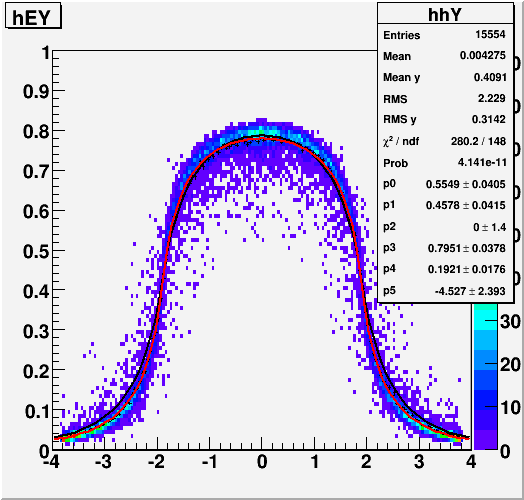
From these events, I look at only those photons that are within +-0.05cell width from the center line in at least in one direction. Then I look at the energy deposited in the top two cells, and divide each of them by the thrown photon energy. This gives me a fraction of energy in a cell as a function of distance from the cell center to the photon, which is just what's in the Yiqun code.
This energy in a cell vs. distance function is made of of a function that has the following form.

I took the distributions from the GSTAR results, and fit the above function by letting all 5 parameters vary. (a1+a2+a3=1) When I do this on the distribution from Y-direction, I get the following.
Fig. 2. Energy in a cell vs. Distance (in cm) from cell center to the photon in Y direction. Red: new fit, Black: default values
With this new fit, the resolution in Y-direction looks like this.
Fig. 3. Generated vs Reconstructed Y for 30GeV Photons

Fig. 3a. Generated vs Reconstructed Y for 30GeV Photons in 1D
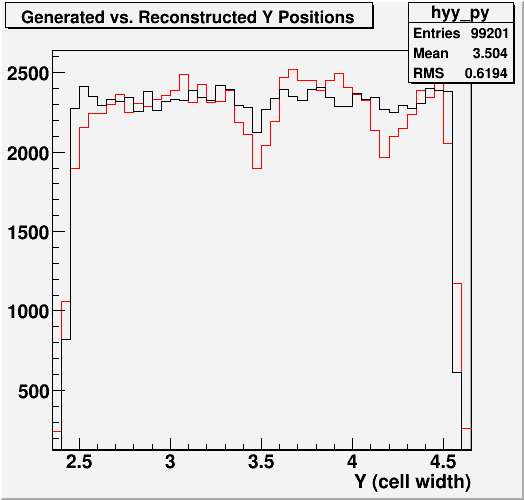
Fig. 4. Difference between generated and reconstructed vs. generated Y
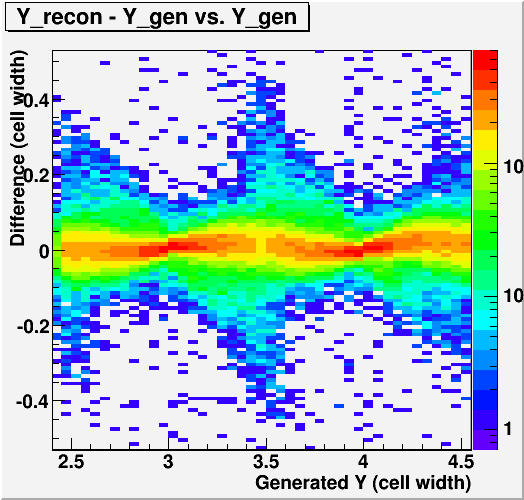
So this is really quite good.
X-direction, on the other hand, has issues, as noted before. Using the above parameterization, this is what we get for resolution in X-direction.
Fig. 5. Generated vs Reconstructed X for 30GeV Photons
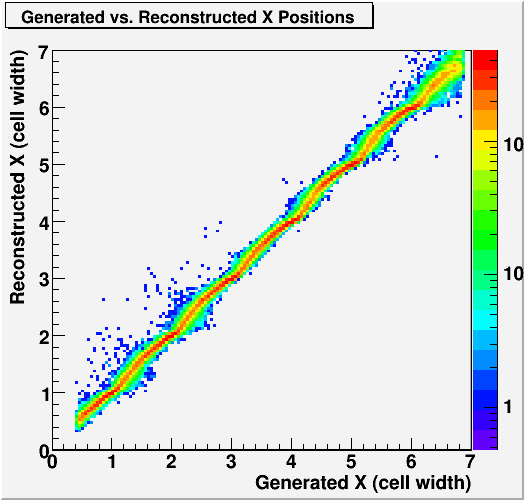
Fig. 5a. Generated vs Reconstructed X for 30GeV Photons in 1D
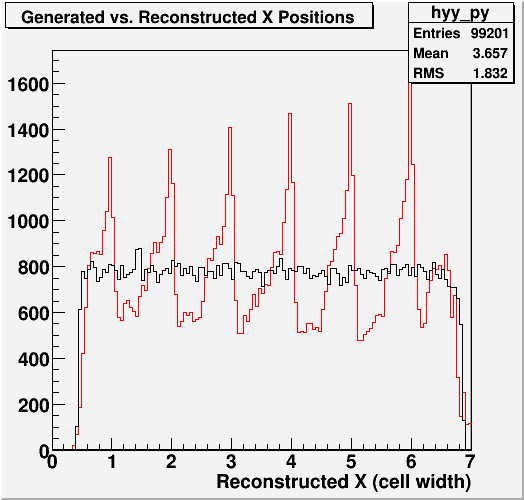
The main problems in the X-direction are,
1. There is a positive vs. negative asymmetry. The shower looks different on the away side of the beam compared to the near side.
2. The fit function doesn't seem to be able to capture the shape very well at all, even when I allow all parameters to vary freely independent of the Y result.
Fig. 6. Energy in a cell vs. Distance (in cm) from cell center to the photon in X-direction.
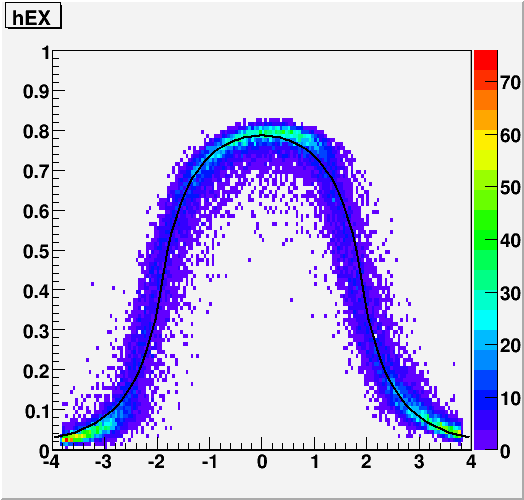
Fig. 6a. Energy in a cell vs. Distance (in cm) from cell center to the photon in X-direction. Red: new fit, Black: default values
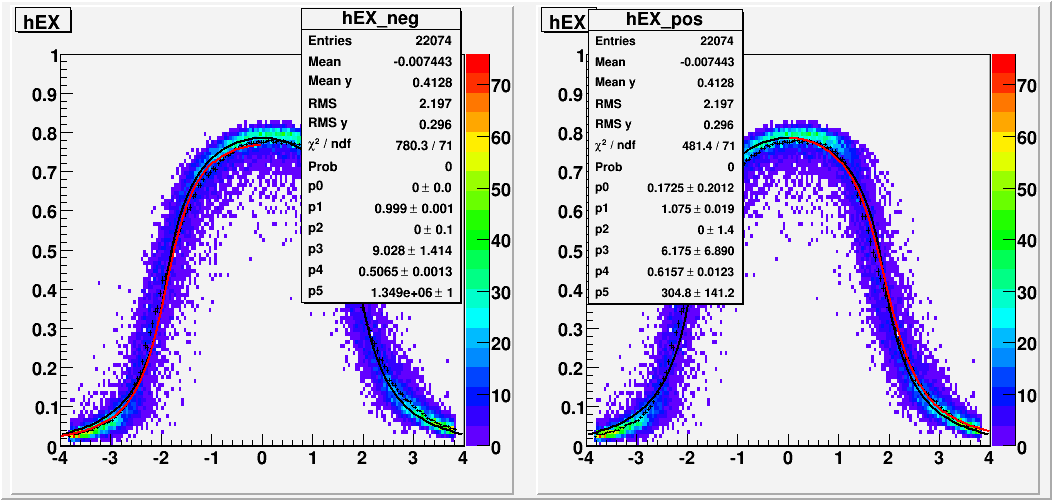
As can be seen, basically only one of the three functions gets all the weight, and it's a poor fit at the end. The situation is similar if we look at this as a function of X-position.
- leun's blog
- Login or register to post comments
