- leun's home page
- Posts
- 2013
- 2012
- December (2)
- October (3)
- September (2)
- August (1)
- July (4)
- June (4)
- May (2)
- April (3)
- March (5)
- February (5)
- January (5)
- 2011
- December (3)
- November (3)
- September (5)
- August (2)
- July (2)
- June (3)
- May (4)
- April (4)
- March (2)
- February (4)
- January (2)
- 2010
- December (2)
- November (3)
- October (3)
- September (5)
- August (6)
- July (2)
- June (4)
- May (3)
- April (4)
- March (4)
- February (2)
- January (4)
- 2009
- 2008
- October (1)
- My blog
- Post new blog entry
- All blogs
FMS meeting 20100830
Measuring the Shower Shape in Data
Taking a hint from 2006 pb-glass shower shape paper, I've decided to measure the shower shape in data myself. The problem of course is that I don't know the true coordinate of the photon, but 1. if we know the thrown distribution, and 2. if the gains are reasonably uniform, then we can indirectly relate the true coordinate with the reconstructed coordinate.
I took the "isolated photon" sample from the data, which is basically well reconstructed Pi0 events with large Z just above trigger, which means large separation. (greater than 2 cell width) As noted, it's important that the gain correction is already reasonable, (kind of a chicken and egg problem), but if I only look at the central three rows, I was able to find a version of the calibration that looks reasonable in terms of the uniformity of event distribution.
Fig. 0. Distribution of "isolated photon" sample from data
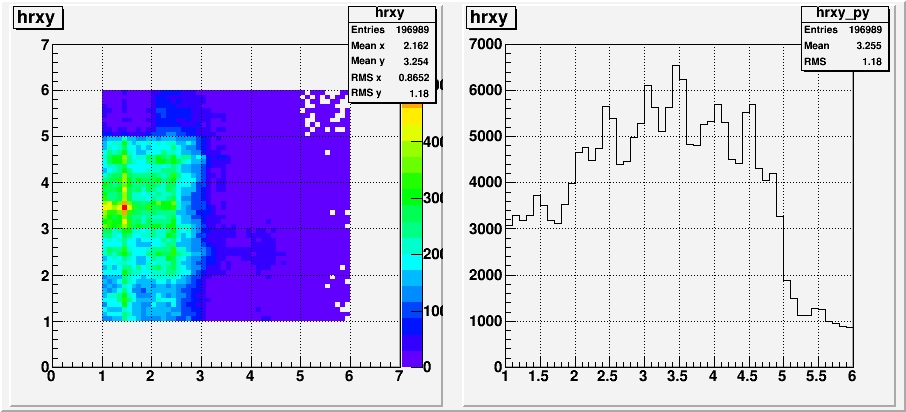
Fig. 1. Reconstructed Y distance from the edge distribution from Y=2 to Y=5
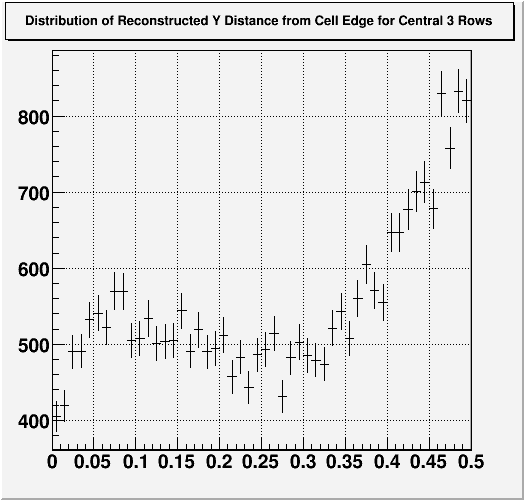
Turns out, according to the full simulation, with perfect gain, this distribution between Y=2 and Y=5 is "flat". Using this fact, we can generate the relationship between reconstructed Y vs. "true" Y.
Fig. 2.
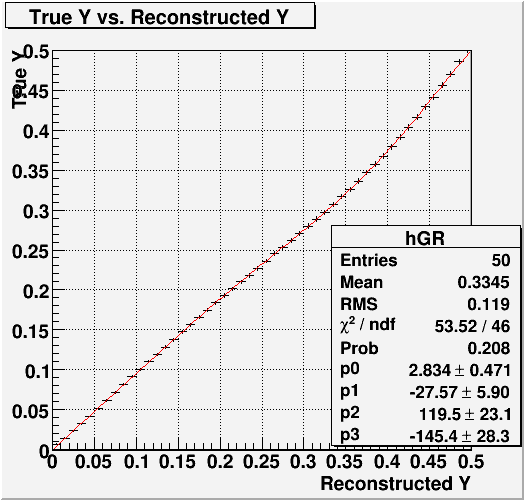
Based on this fit function, I can generate the usual shower shape distribution in data in terms of "true" X and Y. While the difference between "true" and reconstructed is not drastic, the reconstructed tends to have a bias that tries to mimic the shower function used for reconstruction.
Fig. 3. Shower Shape Distribution in Data with Shower Function from MC overlaid
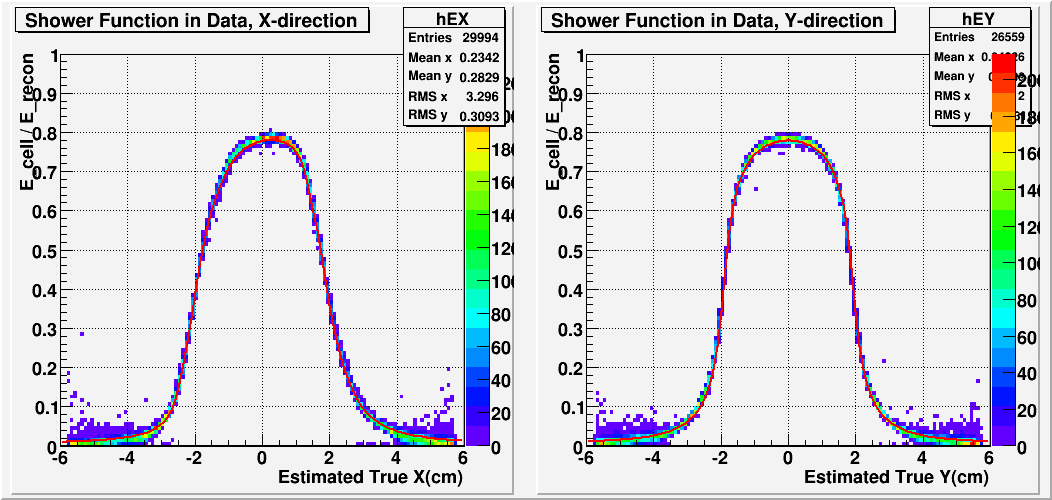
Fig. 4. Data vs. MC comparison 1.
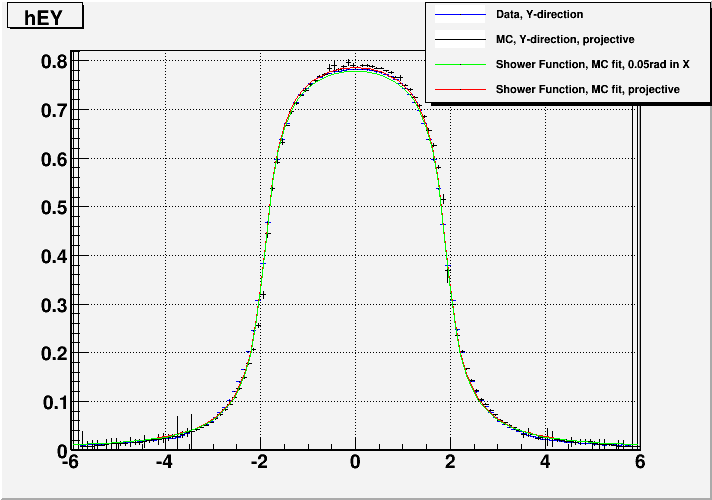
Fig. 5. Data vs. MC comparison 2.
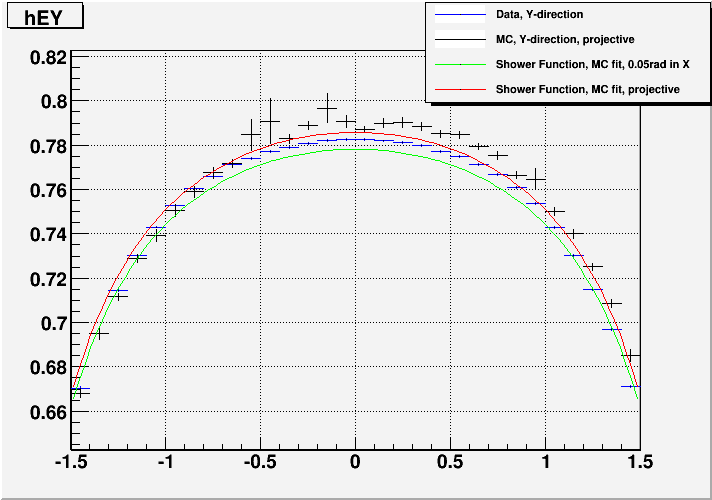
Fig. 6. Data vs. MC comparison 3.
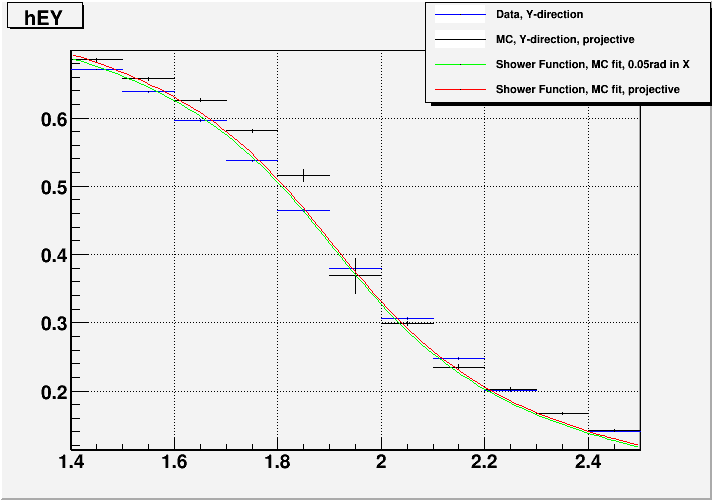
Fig. 7. New fit to the data in Y-direction using 4-slice Incident Angle shower function 1.
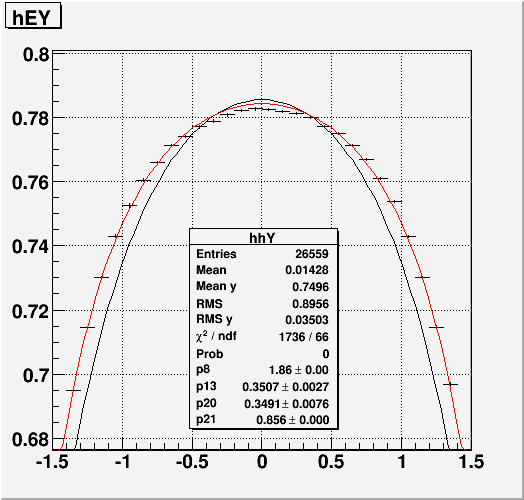
Fig. 8. New fit to the data in Y-direction using 4-slice Incident Angle shower function 2.
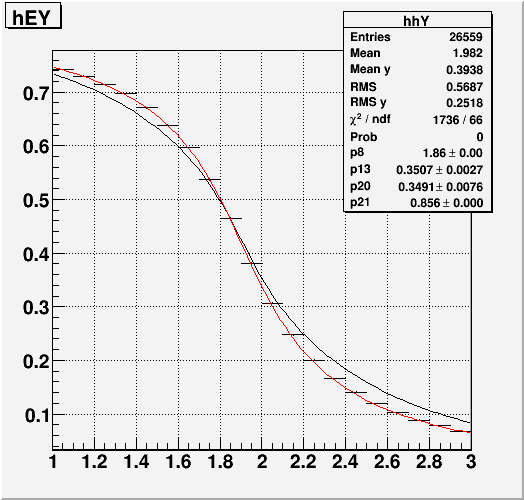
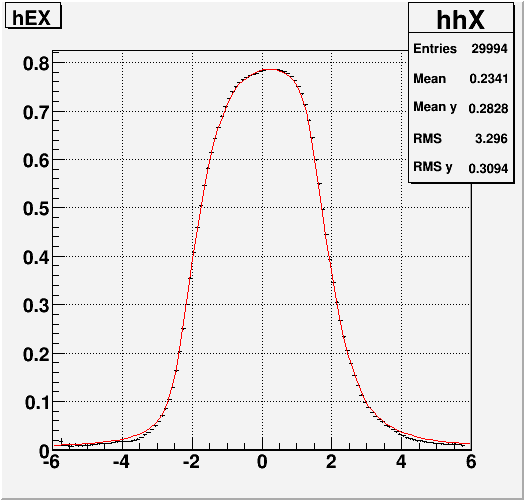
Fig. 9. Data shower function in X-direction with the newly fit shower function (above) with incident angle = 0.05rad.
- leun's blog
- Login or register to post comments
