- leun's home page
- Posts
- 2013
- 2012
- December (2)
- October (3)
- September (2)
- August (1)
- July (4)
- June (4)
- May (2)
- April (3)
- March (5)
- February (5)
- January (5)
- 2011
- December (3)
- November (3)
- September (5)
- August (2)
- July (2)
- June (3)
- May (4)
- April (4)
- March (2)
- February (4)
- January (2)
- 2010
- December (2)
- November (3)
- October (3)
- September (5)
- August (6)
- July (2)
- June (4)
- May (3)
- April (4)
- March (4)
- February (2)
- January (4)
- 2009
- 2008
- October (1)
- My blog
- Post new blog entry
- All blogs
FMS meeting 20101206 - simulation update
PYTHIA + GSTAR Production for X-section Analysis
The running parameters I've settled at this point are,
1. No air gap
2. Thick aluminum to minimize the thin volume problem. (100 microns, used to be 10 micron)
3. 6.5% increased reflectivity on the Alm surface.
For the record, the thin volume problem seems to be well known for Geant 3. (Or at least I met a PHENIX Geant expert who knew exactly what I was talking about) For our case, the problem seems to be that the track overshoots a thin layer and calculates the interface between volume 1 and 3, not 1 and 2 as it should. Geant 4 seems not to do this.
I've also moved the cathode efficiency to the generation level. The CPU time gets better, but not as good as what Steve can get, as I allow one step before I remove the photons while Steve gets rid of them on the stack level.
I don't know what the exact factor is for the final CPU time per event compared to the energy loss, but I think it's more than 10 and less than 100. However, turns out running full Pythia is not dominated by photon tracking time, because my Pythia filter includes hadrons and a large portion of the events go to waste.
Consequently, I was able to push 1/pb worth of Pythia output through GSTAR during last week while I was traveling. Even back when we were using the energy loss, this took a few days as well. So overall the time loss seems to be manageable.
Fig. 1. Energy dependent mass shift

The evidences are that my energy dependence in the simulation is a bit too much right now. My shower shape is also still a tad bit flatter than what I'd like, so maybe a bit more reflectivity is in order. That, or we call this good enough.
The other nice surprise is that now the mass spectrum matches up very well, including the pi0 peak width. Before, I was forced to put in a very large vertex measurement error (~35cm) and still couldn't get the pi0 peak width to be wide enough in the simulation. The following plots have zero vertex error, and on average simulation width is ~2% narrower. This can easily be mended by putting in a vertex error on the order of ~15cm, which I think is not crazy for BBC vertex. The pi0-eta continuum, once not simulated at all, also looks very nice now.
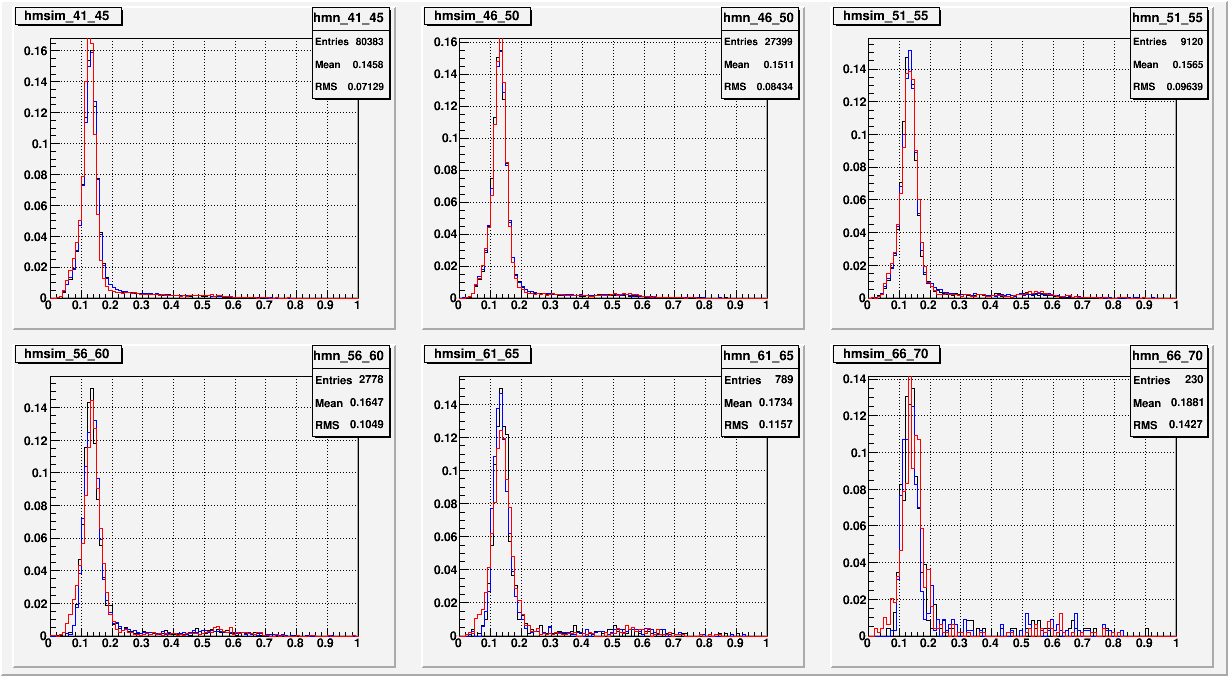
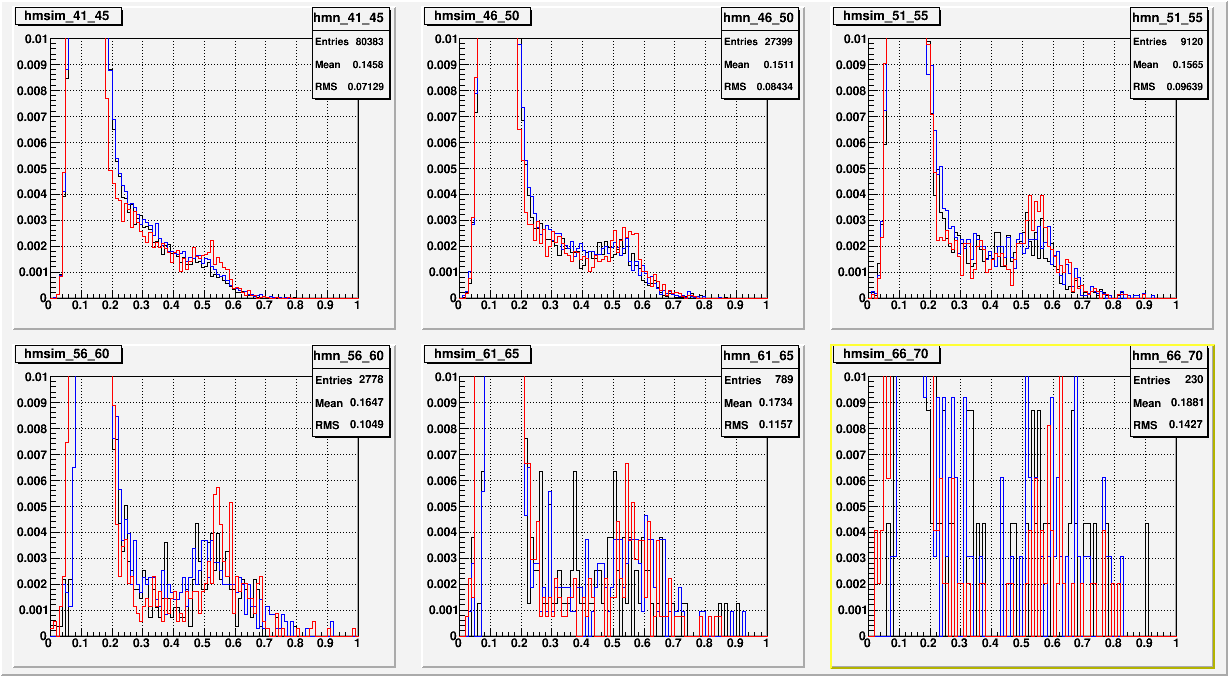
The following plots are the invariant mass distributions in energy bins, from 40GeV to 70GeV in 5GeV interval. 0.25cell width fiducial cut was used, and there is no center cut. Less than half the data and 1/pb of simulation were used.
Fig. 2. Mass spectrum, BLACK: data North, BLUE: data south, RED: Pythia+GSTAR

Fig. 3. Mass spectrum, BLACK: data North, BLUE: data south, RED: Pythia+GSTAR

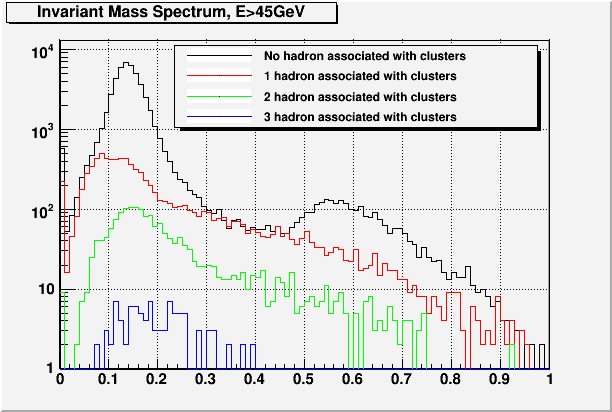
Fig. 4. Break down of mass spectrum for E>45GeV in the number of non-EM tracks associated with clusters.

DISCLAIMER: There might be some over counting. It is in principal possible for a single track to belong to two clusters. I need to fix this.
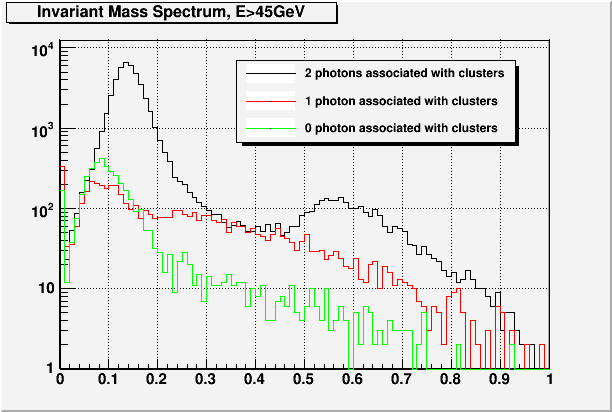
Fig. 5. Break down of mass spectrum for E>45GeV in the number of EM tracks associated with clusters.

Fig. 6. Break down of mass spectrum for E>45GeV, in combination of photons and hadrons.
.gif)
- leun's blog
- Login or register to post comments
