- leun's home page
- Posts
- 2013
- 2012
- December (2)
- October (3)
- September (2)
- August (1)
- July (4)
- June (4)
- May (2)
- April (3)
- March (5)
- February (5)
- January (5)
- 2011
- December (3)
- November (3)
- September (5)
- August (2)
- July (2)
- June (3)
- May (4)
- April (4)
- March (2)
- February (4)
- January (2)
- 2010
- December (2)
- November (3)
- October (3)
- September (5)
- August (6)
- July (2)
- June (4)
- May (3)
- April (4)
- March (4)
- February (2)
- January (4)
- 2009
- 2008
- October (1)
- My blog
- Post new blog entry
- All blogs
FMS meeting 20101213 - simulation, remaining issues
(Hopefully) Final Assessment of the Simulation
After last week's discussion, the following are the parameters I've settled with.
1. No air gap
2. Thick aluminum to minimize the thin volume problem. (100 microns)
3. 7.5% increased reflectivity on the Alm surface. (1% increase since last week)
Last week, we found that the energy dependence was a bit too strong, so I increased the reflectivity by 1% to tone it down a little.
Now the shower shape looks like this.
Fig. 1. Energy resolution ans shower shape, black line is the fit to data.
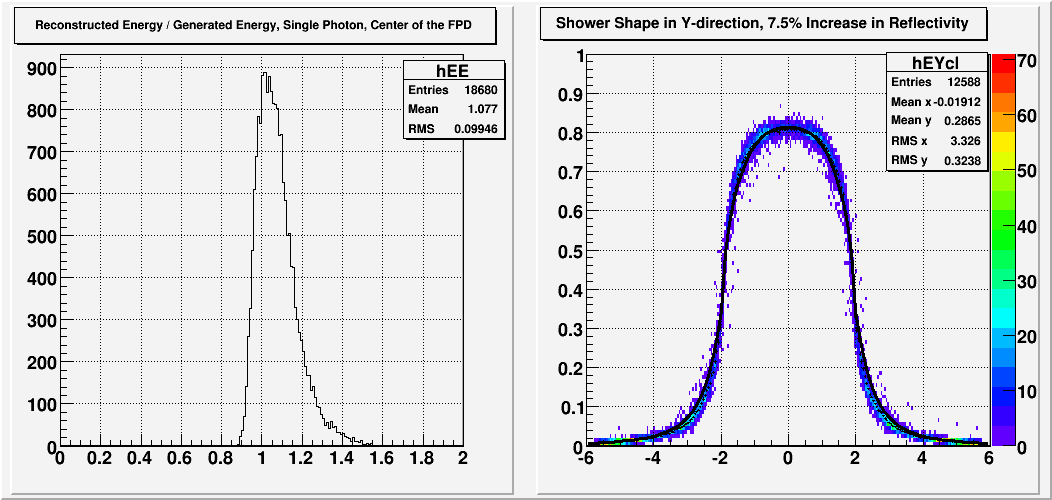
So the shape looks good except the deviation around ~3cm point, which I can't seem to get rid of no matter what. Also notice the right-side tail on the energy resolution plot. The offset from 1 is not terribly important, as it doesn't affect the shower shape and it will be tuned out by calibration. But the asymmetrical tail will likely cause the mass peak to broaden more towards the higher mass side, and also increase the bin-rolling-down effect.
From here on, I've made a list of things in the simulation that I think is noteworthy.
1. Difference between pi0 only and full simulation, and between 1 cluster and 2 clusters
The reason that my initial guess on the parameters was a bit off, I think, was because of the apparent difference between pi0 only and full Pythia when it comes to mass vs. energy. I seem to get stronger energy dependence in full Pythia, especially for 1 cluster 2 photon events.
Fig. 2. Mass vs. Energy, pi0 only and full Pythia
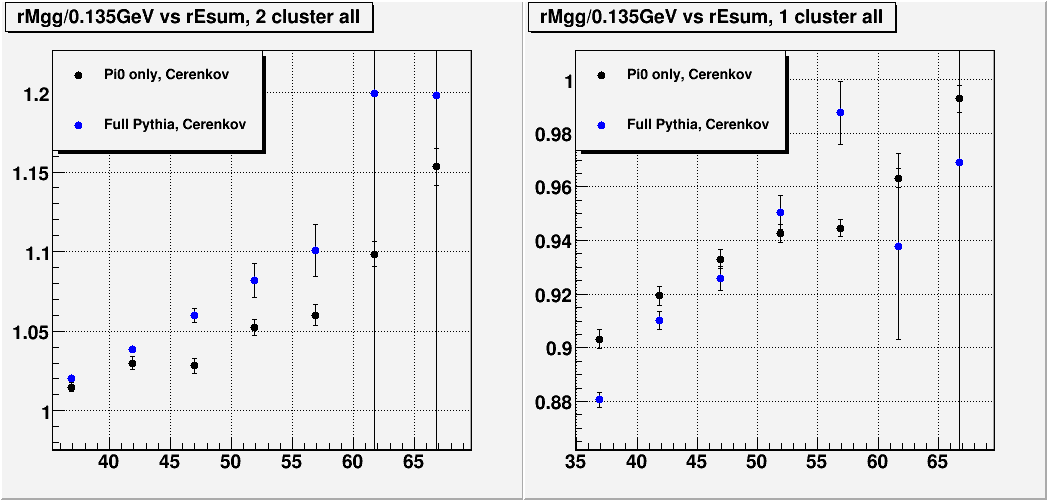
Fig. 3. Reconstructed Energy / Generated Energy vs. Energy, pi0 only and full Pythia
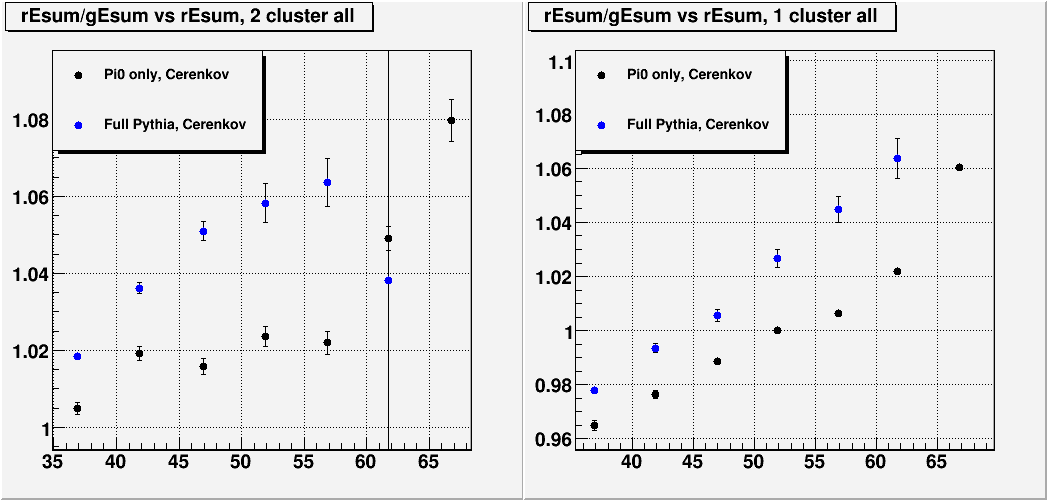
Fig. 4. Reconstructed Separation / Generated Separation vs. Energy, pi0 only and full Pythia
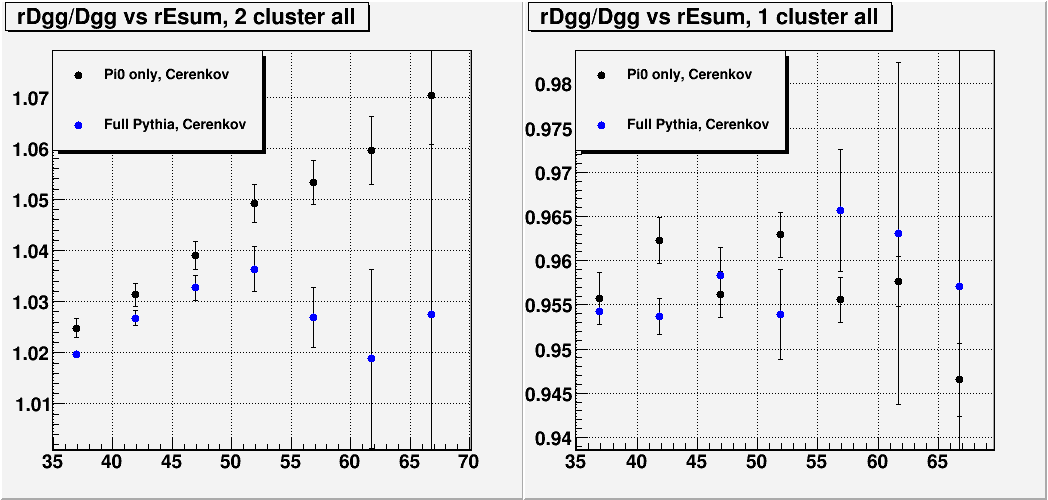
It's clear that the energy dependence of gain for the 1 cluster events is more severe in full Pythia than it is in pi0 only simulation. On the other hand, the 2 cluster events seems to show some difference between the two in the separation measurement. I don't understand the cause of this effect yet.
After I increased the reflectivity, this is what data vs. MC comparison for M vs. E looks like.
Fig. 5. Mass vs. Energy, data and full Pythia + GSTAR comparison.
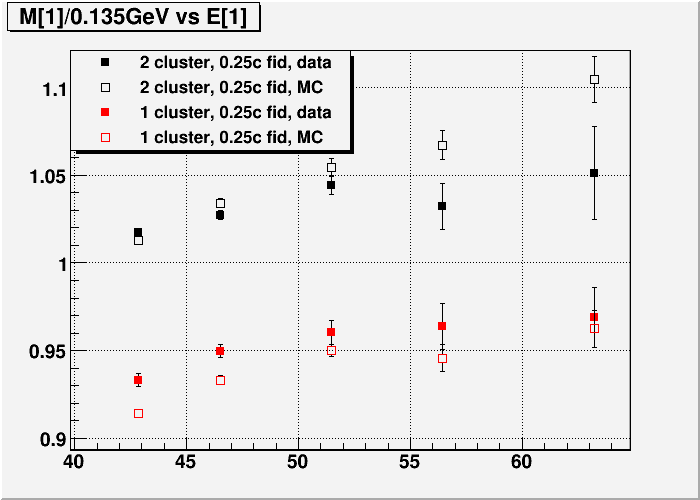
While the slop is reasonable, the difference between 1 and 2 clusters doesn't look right. If it seems like this is worse than last week, it is because the effect of increasing the reflectivity (and thereby reducing the slope) has been to bring down the high energy points for the 1 cluster, instead of pushing up the low energy point. I am currently investigating just what is causing this 1 vs. 2 cluster differences.
2. Mysterious shift in deposited energy as a function of Y
Another issue that we have is that since we shifted to Cerenkov, we have this very pronounced shift in gain that occurs somewhere around row 4.
Fig. 6. Energy Loss, Summed Energy / Generated Energy vs. Y position of the photon, pi0 only simulation
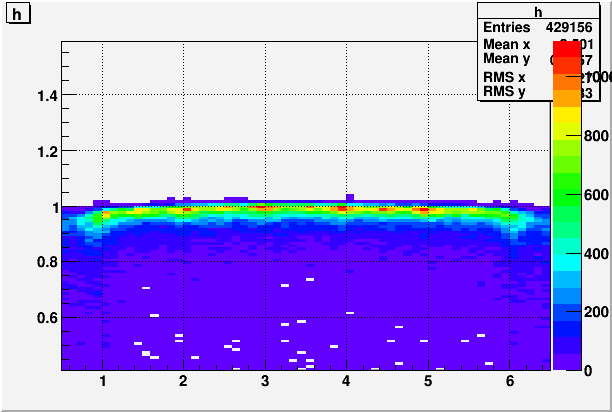
Fig. 7. Cerenkov, Summed Energy / Generated Energy vs. Y position of the photon, pi0 only simulation
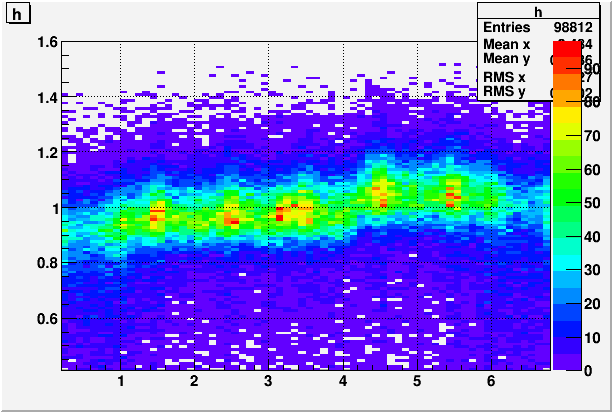
This occurs in full simulation and single photon only simulation as well. While these types of gain shift will in principal be taken out by the calibration, it is still very strange that such a big shift occurs with Cerenkov.
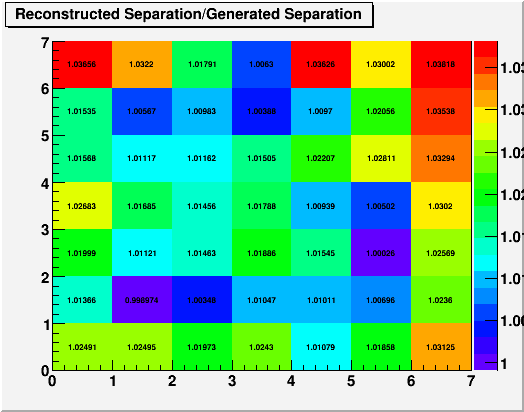
Luckily, the separation behaves reasonably across the detector, meaning that calibration should really take this effect out.
Fig. 8. Separation measurement in the full simulation for calibration cut events, in rows and columns.
3. Mass Spectrum, data vs. MC
I've tried changing the vertex accuracy from 0 to 10cm to 30cm, and it doesn't have a very noticeable effect. The Eta mass peak is still a but too narrow. I've now included ~2/pb worth of simulation for higher energy bins.
Fig. 9. Mass spectrum in energy bins, BLACK: data North, BLUE: data south, RED: Pythia+GSTAR
.gif)
Plots I made last week regarding the source of background had track over-counting issue. That has been resolved, and the following is what we get now.
Fig. 10. Break down of mass spectrum for E>45GeV, in combination of EM-tracks(photons and electrons) and hadrons.
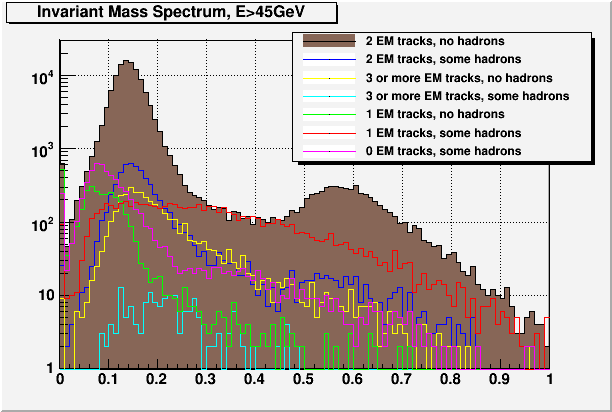
So it is still true that most of the continuum seems to come equally from two photon events and the events that have one photon and some hadronic junk.
4. Internal decay angle dependence of mass
The single thing that destroyed my confidence on calibration so far was this huge dependence of the mass on the internal decay angle, which wasn't well simulated at all. Now with all the changes, things look much better.
Fig. 11. Mass vs. Internal decay angle / pi, where 0 and +-1 corresponds to horizontal. BLACK: data North, BLUE: data south, RED: Pythia+GSTAR
The first panel is for row 0, the second is for row 1, the third is for row 2~3 and the fourth is for row 4~6. (Sorry for the lack of labeling)
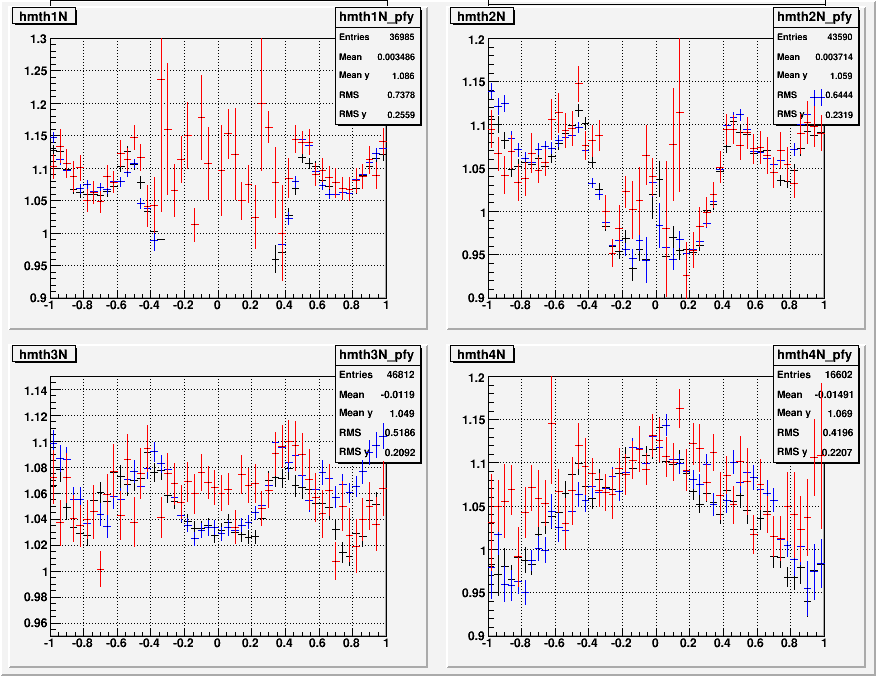
While it's not perfect, I believe at this point things look good enough to generate channel by channel target mass based on simulation.
I was able to run 2/pb of GSTAR plus many reconstruction passes between Monday and Thursday. I was getting really quite amazing amount of CPU time, for some reason. I think at a pace anything like I've seen last week, getting 4~5/pb more should be doable in a few weeks. At the same time, I will proceed with the calibration of the data.
- leun's blog
- Login or register to post comments
