- leun's home page
- Posts
- 2013
- 2012
- December (2)
- October (3)
- September (2)
- August (1)
- July (4)
- June (4)
- May (2)
- April (3)
- March (5)
- February (5)
- January (5)
- 2011
- December (3)
- November (3)
- September (5)
- August (2)
- July (2)
- June (3)
- May (4)
- April (4)
- March (2)
- February (4)
- January (2)
- 2010
- December (2)
- November (3)
- October (3)
- September (5)
- August (6)
- July (2)
- June (4)
- May (3)
- April (4)
- March (4)
- February (2)
- January (4)
- 2009
- 2008
- October (1)
- My blog
- Post new blog entry
- All blogs
FMS meeting 20100606
Yet Another Look at the Shower Shape
The main problem that remains is that the energy dependent mass shift is still not fully understood. We have identified multiple causes (mostly related to the two photon separation) in the full simulation, and applied various corrections to both data and simulation. Unfortunately, it only removes ~half of the M vs. E slope from the data. So the question is just what is still left in the data to cause the systematic shift of mass as we move up the energy.
There are three shower shapes in the problem. The real one from the data, the simulated one from GSTAR, and the fit function. At this point, I suspect that at least some of the features in the simulation that cause the separation mis-measurement can be traced back to the difference between the simulated shower, and the shower function. More specifically, a difference not in the tail, but somewhere closer to the center. (For instance, why does log weighting improve the data-MC match so dramatically? Removal of the tail alone doesn't do much.)
Another possibility is that it's a clustering problem, and in fact we know that there are issues with the clustering as well. (Namely, energy over-counting for small separation, two cluster events)
But for a starter, we will take a look at the shower shape first.
Inspired by what Steve did on the FMS data to look for the Eta signal, I've collected FPD events that potentially have isolated photons. These are ~35GeV two photon events with good pi0 mass (0.125~0.145) and large separation. (Large Zgg) I also demanded that the big photon be away from the edge by at least 1 cell width. This gives me 30GeV-ish semi-isolated photons in the meaty part of the detector.
Fig. 1. Data isolated photon candidate
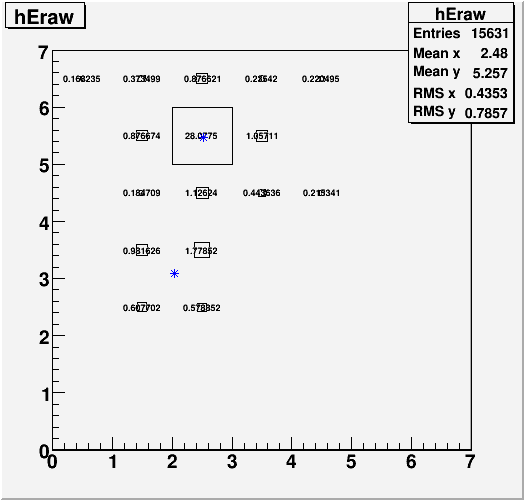
Of these events, I selected ones where the big photon was reconstructed to the very center of a cell. This means that there is a very dominant high tower, and the 4 first neighboring cells get equally small amount of energy. The idea behind this is that the ratio between the high tower energy and the sum of the 4 neighbor energy is some measure of the width of the shower just off the peak.
So now we look at this ratio, defined as the summed energy of the 4-neighbors divided by the high tower energy. If this number is small, it means the shower is narrow off the peak. I'm using the data sample described above, and the single photon, flat distribution simulation with Egamma>30GeV. Turns out there is little energy dependence in this, at least according to the simulation.
Fig. 2. E(4-neighbor) / E(HT)
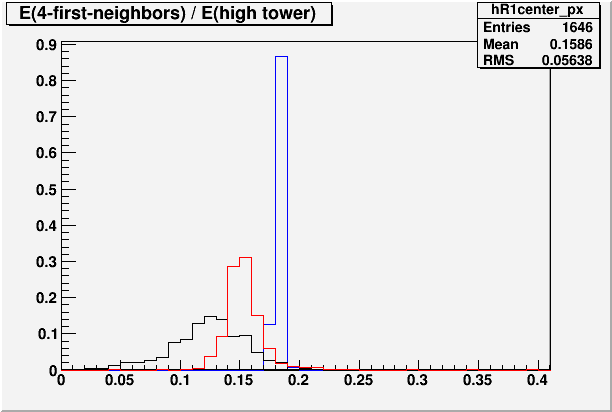
Blue is the fit function. It's the "correct answer" according to the fit. Red is the single photon simulation, and Black is the data.
For the data, on average, we have about ~12.5% of the HT energy deposited in the 4 neighbors. For the simulation, we get about 15%. For the fit function, we get over 18%. This order, where the shower function is the widest, followed by the simulation, with the data being the narrowest, is something that I've always suspected. For instance, photons tend to congregate around the center of a cell much more in the data than in the simulation.
So what does this mean? I don't know for sure yet, but I think this difference can easily affect the two photon separation. Take for instance a case where two photons are diagonally neighboring. ( Dgg~sqrt(2) ) The clustering will split them off into separate clusters, since it'll find a diagonal valley. But the height of that valley will obviously depend on this ratio, and that can presumably push or pull the photons relative to each other.
That's it for speculations, and here are some observations.
1. Yiqun spontaneous symmetry breaking
Apparently, the same exact energy distribution can cause the fit to give you different result based on the orientation and/or coordinate. And it happens in a way that does not respect the symmetry of the original distribution.
For the next 4 plots, I put two overlapping 3X3 energy distribution by hand, mimicking the distribution of two 25GeV photons based on what I learned from the data photon sample. The idea was to see how reconstruction reacts to the shower shape that is narrower than what it thinks it should be, in the absence of any other detail.
Left-hand side is the hand--made distribution that goes into the reconstruction. Right-hand side is the "correct answer" from the fit. The original distribution is the same for all 4 plots, except for the orientation and position.
Fig. 3a. distribution 1.
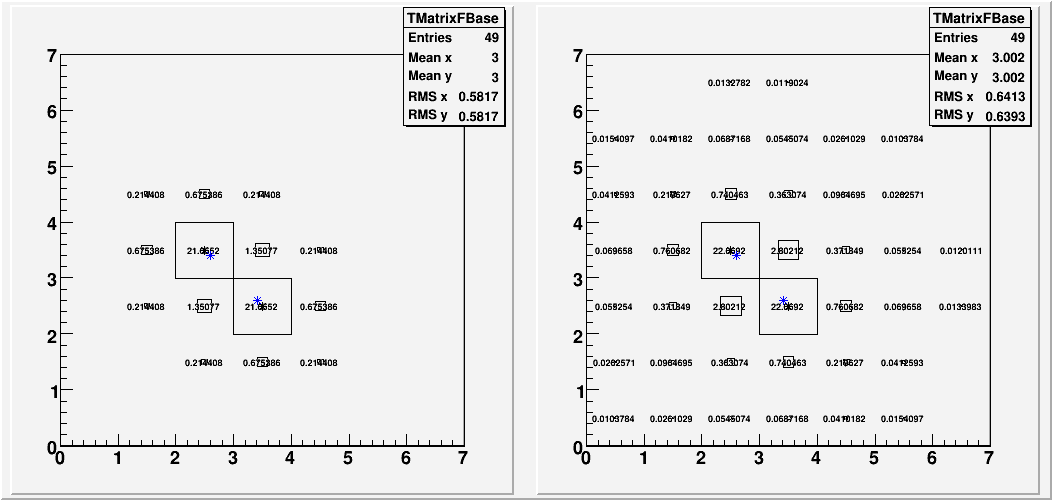
Fig. 3b. distribution 2.
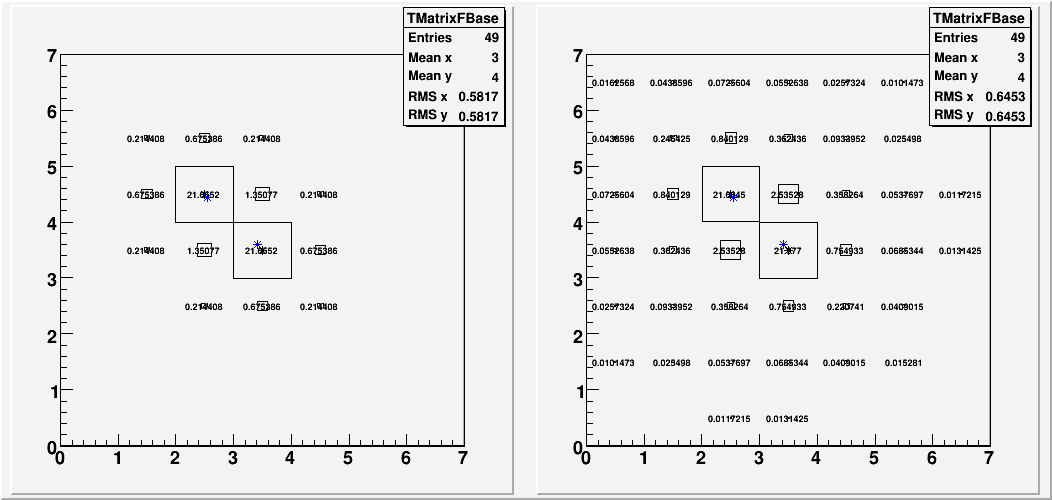
Fig. 3c. distribution 3.
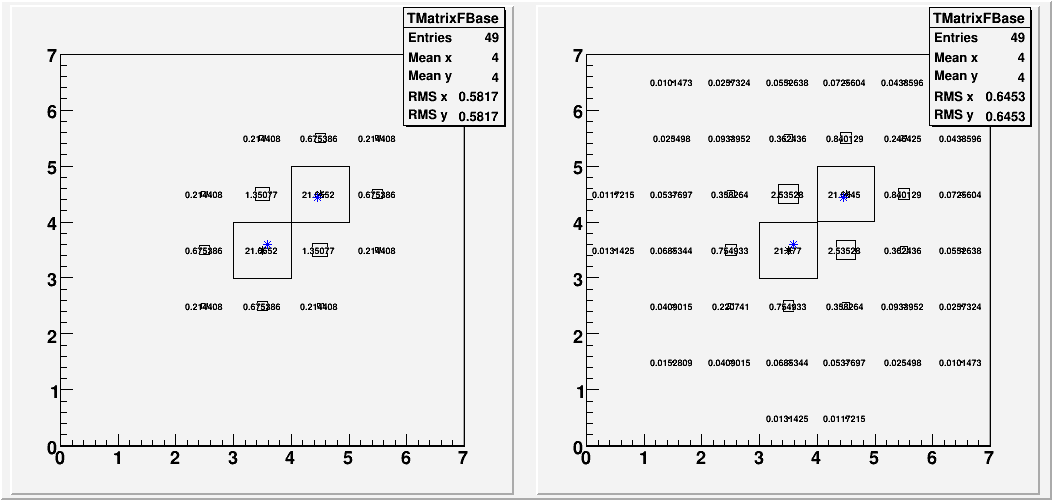
Fig. 3d. distribution 4.
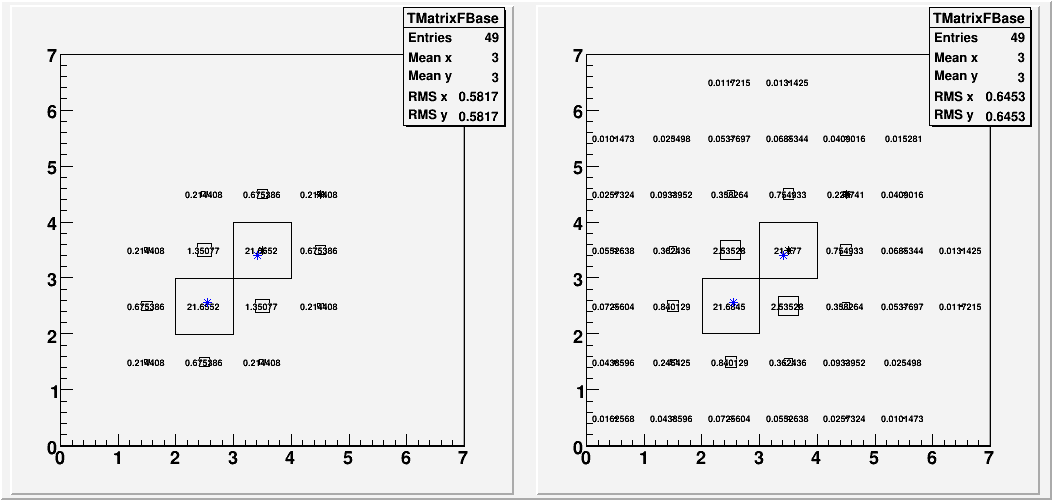
Of these, only the first one (3a) is symmetric. The other 3 shows the photon at the center to be attracted to the other one more. (Blue stars indicate the reconstructed position)
2. Width of the shower vs. Dgg
Another thing to notice is that for all 4 cases, the separation was more than 10% smaller than sqrt(2). Granted, this is a very crude, fake shower shape, but knowing that it's main feature is the narrowness, it's still interesting that it went that direction than the other way.
To see if the "correct" shower would improve things, I created a two photon energy distribution based on the shower function. First I put a 25GeV tower at (3,2), and took the distribution that the fit generated. Secondly, I did the same thing at (2,3). Finally, I added the two distributions to form a single energy distribution. This gives me the two photons distribution according to the shower functions, albeit with increased energy. (Each photon goes from 25GeV to 28.5GeV) This distribution was put into the reconstruction, and this is the result.
Fig. 4. Left: Superposition of two showers from two separate single photon fits. Right: Fit result.
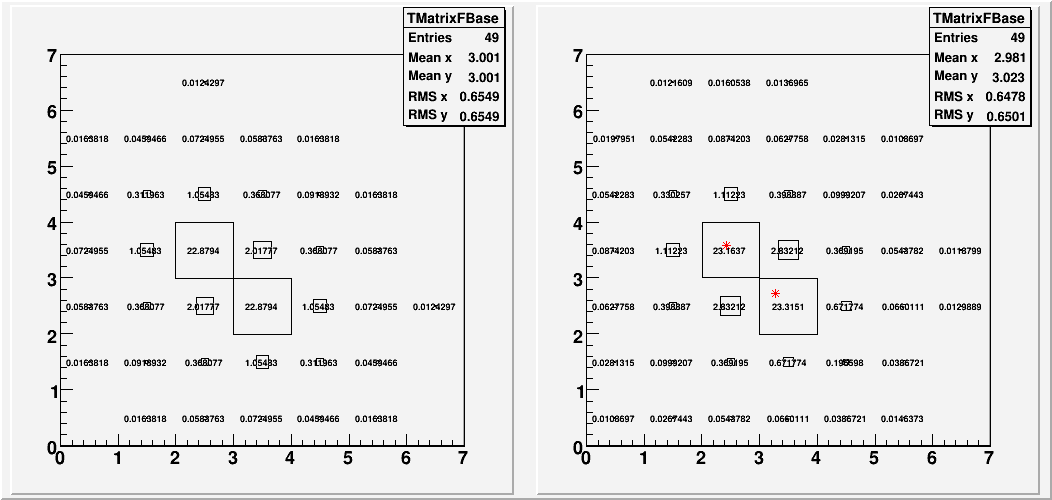
Once again, the symmetry was broken. Furthermore, the separation is still 15% lower than what it should be. So apparently, feeding the superpositions of the single photon shower shape according to the fit is not a good thing to do.
Finally, I tried to look at the dependence of Dgg on the width of the shower, albeit with a very crude model.
Again, I generated a hand-made simplified two photon distribution, using some ratio of E(4-neighbor) to E(HT). Let's call this ratio R1. I only filled in 5 cells, (HT and the 4 neighbors) while varying R1 from 0 (only HT) to 0.25 (4 neighbors share 25% of the high tower energy). For example,
Fig. 5. Example distribution, with R1=25% (Smaller R1 means narrower shower)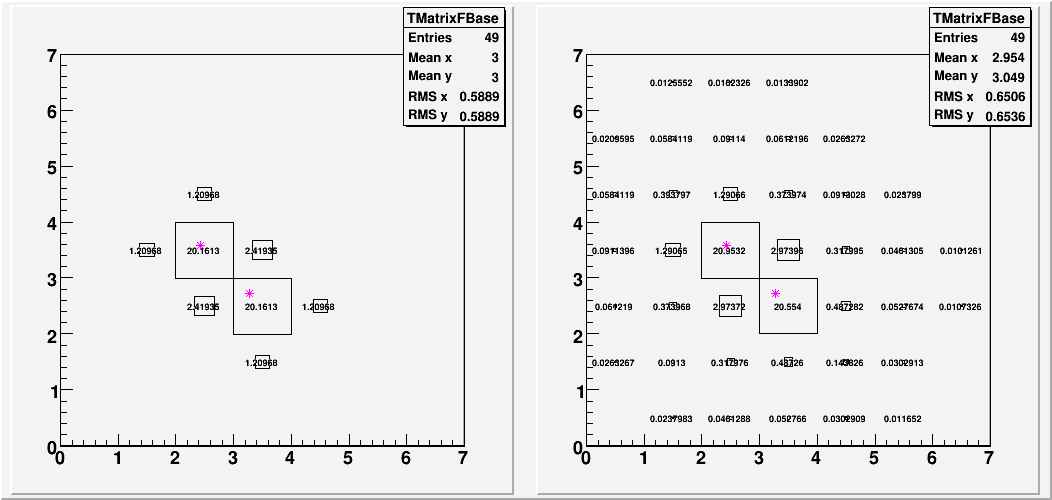
From this, I plotted Dgg/sqrt(2) vs. R1.
Fig. 6. Dgg/sqrt(2) vs. R1
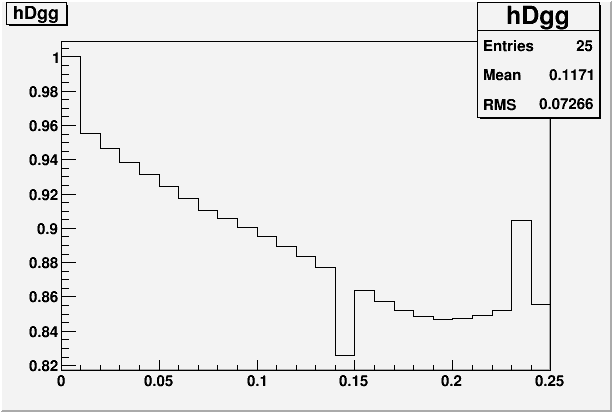
It's not exactly smooth, and overall it's just too inaccurate, so I'm not saying that this is what happens in data. But the trend is interesting. As we make the valley higher and higher relative to the high tower, the separation gets smaller and smaller. If we ignore the offset and only focus on trend, this is consistent with the picture where the narrowness of the simulation shower relative to the shower function causes Dgg to be over-estimated at small Dgg, and the same occurs more severley in the data since data shower is even narrower still. (data ~ 0.12, MC ~ 0.15, shower function ~ 0.18) I will look into this in more detail soon.
- leun's blog
- Login or register to post comments
