- leun's home page
- Posts
- 2013
- 2012
- December (2)
- October (3)
- September (2)
- August (1)
- July (4)
- June (4)
- May (2)
- April (3)
- March (5)
- February (5)
- January (5)
- 2011
- December (3)
- November (3)
- September (5)
- August (2)
- July (2)
- June (3)
- May (4)
- April (4)
- March (2)
- February (4)
- January (2)
- 2010
- December (2)
- November (3)
- October (3)
- September (5)
- August (6)
- July (2)
- June (4)
- May (3)
- April (4)
- March (4)
- February (2)
- January (4)
- 2009
- 2008
- October (1)
- My blog
- Post new blog entry
- All blogs
Run6T FPD Re-Calibration
Run6T FPD Re-Calibration
Because of the fact that we are now proposing to use a new way to calculate the energy, along with a new more aggressive fiducial volume cut, the previous calibration obtained for the FPD using the summed energy everywhere and 0.5cell from the edge fiducial volume cut would probably not be adequate for the new analysis. Here we look for a method of calibration that will provide us with acceptable accuracy in energy scale.
Fig. 1. Mass distribution for data using summed energy, with Esum>30GeV, Zgg<0.85, and new 0.25cell fiducial cut.
.gif)
Since the original calibration was done under a similar condition, (albeit not exactly the same) it's not surprising that the variation across the detectors are fairly modest. The 10% offset is not really understood at this point, but the overall offset is not really a problem. What is more of an issue is that because the summed energy falls off significantly as we approach the edge, this calibration implies that the edge cells have boosted gains to compensate for the loss. This is ok to the first order, but its effects on shower shape and reconstructed positions are hard to predict.
Fig. 2. Mass distribution for data using corrected energy, with Esum>30GeV, Zgg<0.85, and new 0.25cell fiducial cut.
.gif)
Using the corrected energy, which attempts to compensate for the transverse energy loss at the edge based on reconstructed energy, we see that we are effectively "double correcting" at the edge. It is clear that we need to recalibrate the detector using the new energy definition.
The question is then how we proceed with the re-calibration. The easist thing to do is just do what we've been doing all along, that is to set the Pi0 mass centroid to the expected value cell by cell, only change being the use of the new energy definition. At the end of the day this is probably very close to what we will end of doing, but in the mean time here are some studies using full simulation on the effectiveness of that method.
Fig. 3. Mass distribution using corrected energy, under perfect gain. All other cuts are the same as figure 1 and 2. The only variations are up to 1cnt pedestal correction and ADC granularity based on the existing gain.
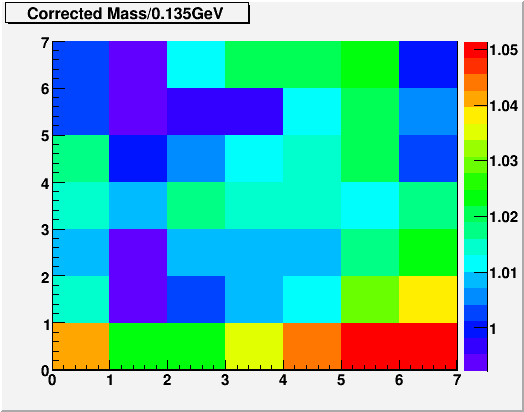
We see here that even with perfect gain and new energy definition, there are couple percent variations acorss the detector.
Fig. 4. Corrected/Thrown Energy distribution
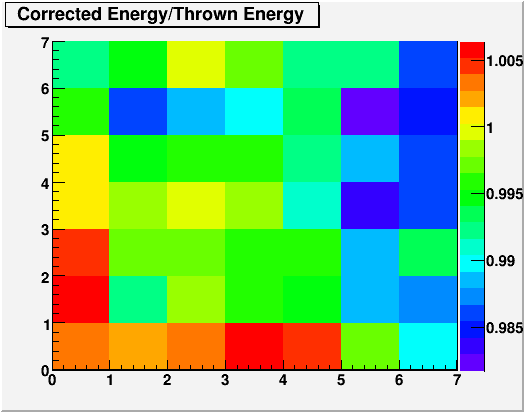
Apparently, the energy is well constrained, as it should be under perfect gain as long as the new definition of energy is consistent with simulation.
Fig. 5. Measured/Thrown Mass and Sepatation distributions with perfect gain
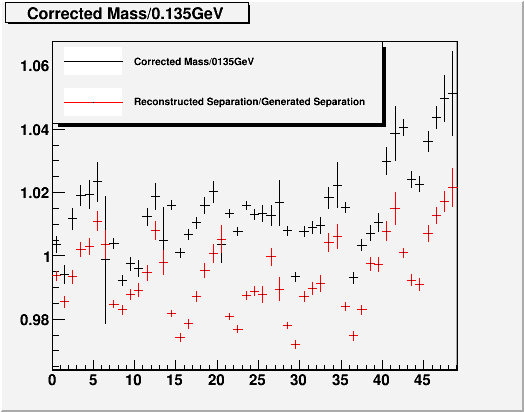
Here we see that it's again the separation measurement that produces a funny structure in mass. Apparently we tend to undershoot the separation closer to the beam, and overshoot it away from the beam. These are all with Ecorr>30GeV, with no upper bound.
It seems that simply using the target mass cell by cell does not give us sensitivity better than a few percent. It will be better than that once we average over the detector, but for cross section measurement we would like to do a little better. One possibility (which has been used by Steve in the FMS calibration) is to use physical symmetries of the detector to constrain gain pair-wise, or even quadruplet-wise using up-down and north-south symmetry. Since we only simulated the south, here we look at pair-wise comparison using up-down symmetry.
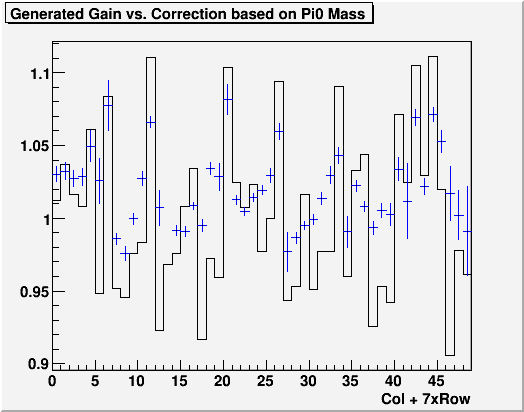
For the following simulations, we've put in random cell by cell gain variation using 5% width gaussian. This is probably much worse than what we already have.
For the Pi0 mass, only events with Esum>30GeV that have two separate clusters and reconstructed separation greater than 1.9cell were included.
Fig. 6. Comparison of generated gain variation(black) and gain correction obtained from Pi0 mass fits(blue)
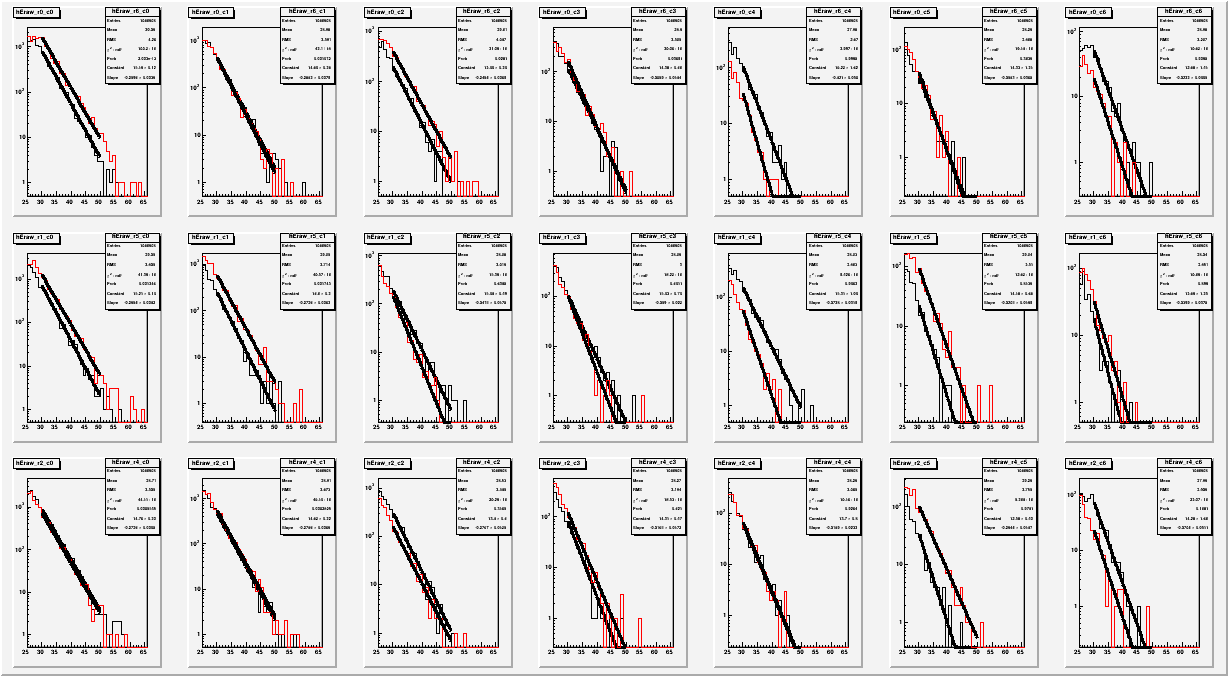
Apart from the usual mass centroid, we've also looked at the possibility of using the energy spectrum by fitting exponential and demand that the slope be the same for symmetric cells. The nice thing about the exponential fit is that the effect of gain variation and pedestal variation factors out as slope and constant. The bad thing about it is that the exponential fit tend to be very sensitive, and unless we have very large statistics, the errors are too big.
Fig. 7. Exponential fits shown pair-wise for available 3X7 pairs in the south.
The Pi0 mass centroid based gain corrections are paired by expressing them in sqrt(g1*g2) and sqrt(g1/g2). Now we compare the actual pair-ratio of generated gains to ratio of slopes, and g1/g2. (no squareroot here, as g~sqrt(gain))
Fig. 8. Comparison of generated gain ratios vs. ratios obtained from PI0 peak fitting, and energy slope fitting
.gif)
Clearly, the slope fitting is of limited use given the statistics. But the simulation is ~2/pb, which is still factor of 3 or 4 smaller than the data. Overall, we are still not getting accuracy better than a few percent, but given more statistics and study, this might be something we can use.
- leun's blog
- Login or register to post comments
