- leun's home page
- Posts
- 2013
- 2012
- December (2)
- October (3)
- September (2)
- August (1)
- July (4)
- June (4)
- May (2)
- April (3)
- March (5)
- February (5)
- January (5)
- 2011
- December (3)
- November (3)
- September (5)
- August (2)
- July (2)
- June (3)
- May (4)
- April (4)
- March (2)
- February (4)
- January (2)
- 2010
- December (2)
- November (3)
- October (3)
- September (5)
- August (6)
- July (2)
- June (4)
- May (3)
- April (4)
- March (4)
- February (2)
- January (4)
- 2009
- 2008
- October (1)
- My blog
- Post new blog entry
- All blogs
FMS meeting 20100510 Vertex
BBc Vertex
Let's take a quick look at what we expect from including the BBc vertex.
Mgg = measured di-photon mass without BBc Vertex correction
M0 = mass if the real vertex was known exactly (But it still may contain other types of errors)
Z0 = nominal vertex used for the uncorrected mass
delZ = The difference between the nominal vertex and the real vertex. (Should be close to the BBc Vertex)
Z = Z0 + delZ = real vertex
Then we have,
Mgg ~ M0 * Z / Z0 = M0 ( 1 + delZ / Z0 )
Therefore, if delZ measurement is accurate, the Mgg vs. delZ distribution should have the slope of M0 / Z0, where M0 = Mgg(delZ = 0).
Fig 1. BBc Vertex vs. Uncorrected Di-photon mass with center cut
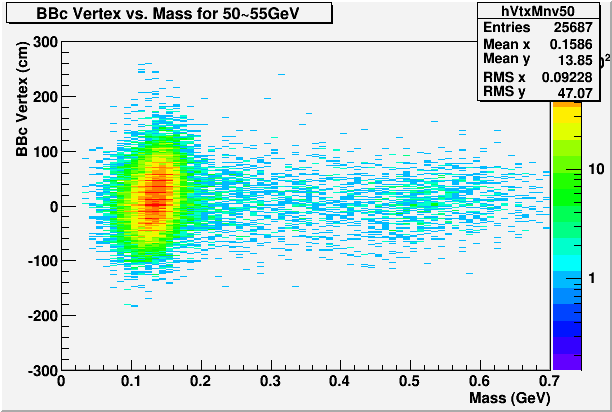
Next, we take the distributions like the above one for all energy bins of interest, take the profileY of it over the pi0 and eta mass regions separately, and fit a line.
We expect the Y offset of the line to be M0, and slope to be M0 / Z0 if BBc vertex is a good measurement of delZ
Fig. 2. Mgg vs. BBc Vertex for Pi0 mass region
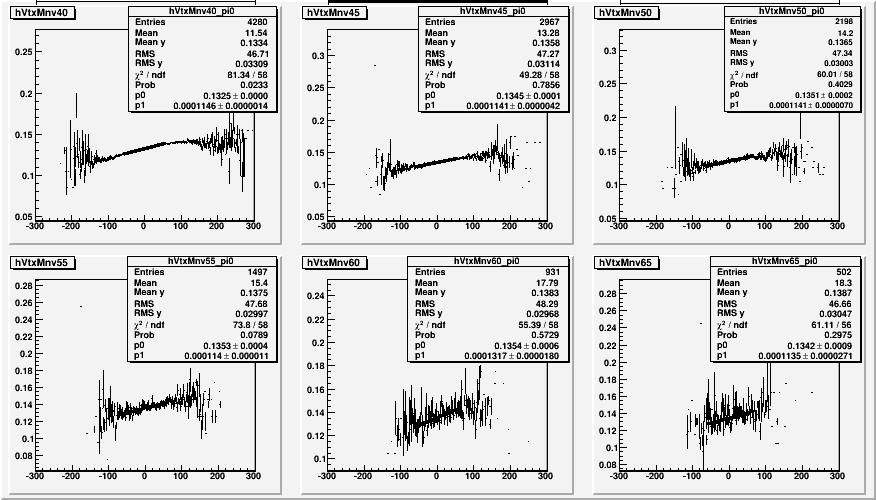
Fig. 3. Mgg vs. BBc Vertex for Eta mass region
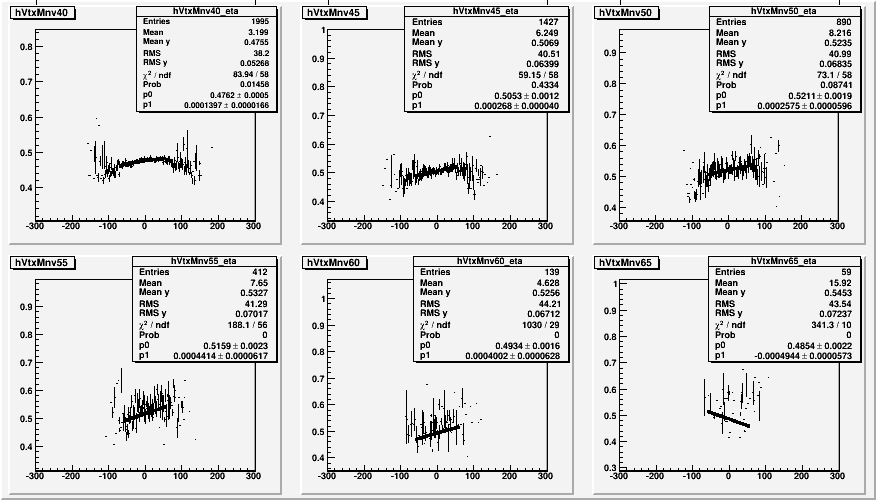
For almost all cases, the slope is smaller than we expect, suggesting that the BBc vertex overeistimates delZ. However, for the case of the Pi0 at least, we can find a scale factor that doesn't depend on the energy much. The same cannot be said for the Eta, which still have problem with the location of the mass peak, and more importanlty, has background that may not behave the same way as the signal.
Fig. 4. Slopes vs. Energy from the above fits
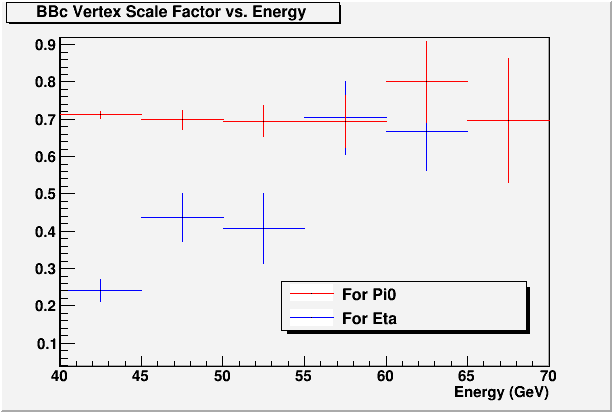
Fig. 5. Offsets vs. Energy

As long as we focus on the Pi0, which after all is almost free of backgrounds and has ample statistics, we can see that a scale factor of 0.7 would work nicely. This comes about presumably because of the substantial error in the vertex measurement, (perhaps on the order of ~30cm) which tend to widen the overall distribution.
Fig. 6. Mass vs. Vertex for E=50~55GeV

So we see clearly that the usual vertex times 0.7 works the better, and other energy bins also look similar to this.
Interstingly, the average vertex position not only has energy dependence, but also have mass dependence
Fig. 7. Average Vertex vs. Mass with no vertex correction
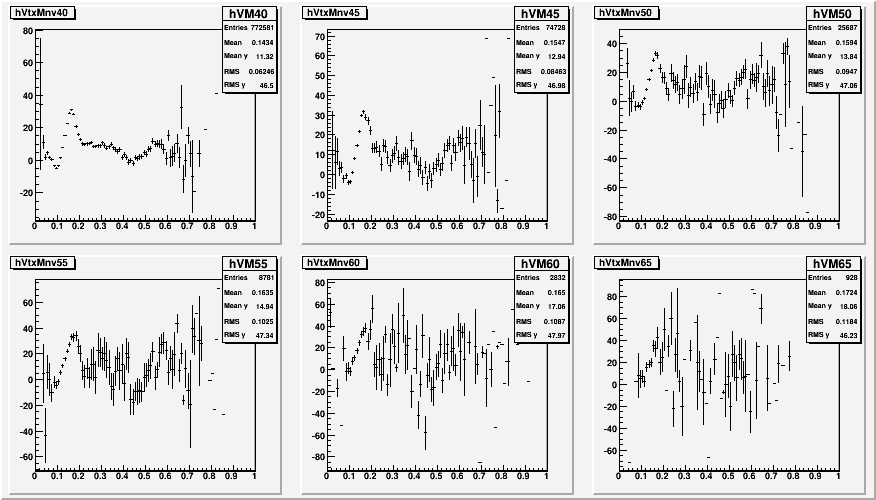
Fig. 8. Average Vertex vs. Mass with 0.7 x BBc vertex
.gif)
We could say that the average vertex is a very indirect measurement of the pseudo-rapidity dependence of the cross section. If the cross-section was flat as a function of eta, we would not expect any bias in vertex away from our detector. The steeper the slope, the farther way the vertex will be from the nominal point. In that note, it's interesting to note that the average vertex actually have the shape that resembles the mass spectrum, and at very high energy, the difference between Pi0 and Eta seem to get smaller. AND, what's happening at 0.3GeV?
- leun's blog
- Login or register to post comments
