- leun's home page
- Posts
- 2013
- 2012
- December (2)
- October (3)
- September (2)
- August (1)
- July (4)
- June (4)
- May (2)
- April (3)
- March (5)
- February (5)
- January (5)
- 2011
- December (3)
- November (3)
- September (5)
- August (2)
- July (2)
- June (3)
- May (4)
- April (4)
- March (2)
- February (4)
- January (2)
- 2010
- December (2)
- November (3)
- October (3)
- September (5)
- August (6)
- July (2)
- June (4)
- May (3)
- April (4)
- March (4)
- February (2)
- January (4)
- 2009
- 2008
- October (1)
- My blog
- Post new blog entry
- All blogs
FMS meeting 20100517
Mass and Separation Comparison between Data and Simulation
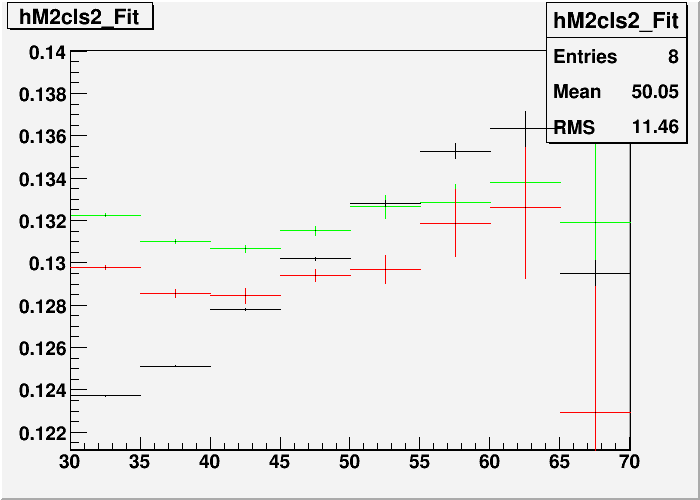
I've noticed that both the mass and the separation distributions from the simulations seems to be wider than the data by roughly the same factor. Just to see what it looks like, I've added completely ad hoc, trial and error, 9% gaussian smearing to the separation distribution from the simulation, which in turn smears the mass. This is 9% independent of the separation or energy, determined based on lower energy separation distribution.
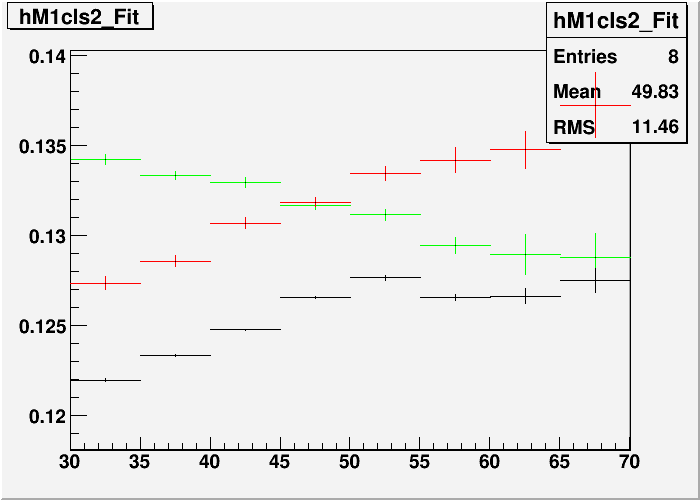
BLACK: Data
GREEN: Simulation
RED: Simulation with 9% Dgg smearing
The simulation has 60cm gaussian vertex convoluted with 35cm gaussian smearing function. The fact that 9% correction ignorant of energy or separation seems to suggest that the vertex resolution in data is much worse than the simulation by a long shot. (9% of ~800cm = 72cm) Correction, this shouldn't have anything to do with Vertex. The smearing is on the separation, which is completely local. Additional smearing in vertex would create additional smearing in Mgg, given the same width in Dgg. That's not really what we see here.
Current BBc Vertex algo does not implement the slewing correction. Akio sent me the code to do it, but I have not implemented it yet. This may just do the trick, I hope.
Apart from the effect of the smearing, we also see that in general, the masses agree better at higher energy, while between 35GeV and 50GeV, the data tends to show lower mass. This is very odd, as the calibration is done between 35 and 40GeV. Granted, the calibration uses extra cuts to enhance the uniformity across the detector etc, but the effect of removing those cuts seem to have different effects on data and MC.
Fig. 1. 1-Cluster Mass, data and MC

Fig. 2. 2-Cluster Mass, data and MC
The following pdf contains a more detailed look at the separation distribution as a function of the internal decay angle, and the column number.
The exact reasons for this additional smearing is not clear yet. It's very difficult to think of a mechanism that will give us fractional smearing almost regardless of other variables. Adding random noise (sigma of ~0.3 ADC count or so) doesn't seem to degrade the position resolution much. One possible reason for the smearing is that the hadronic background is not well simulated.
Fig. 3. Separation in Data vs. MC for clusters with and w/o hadrons
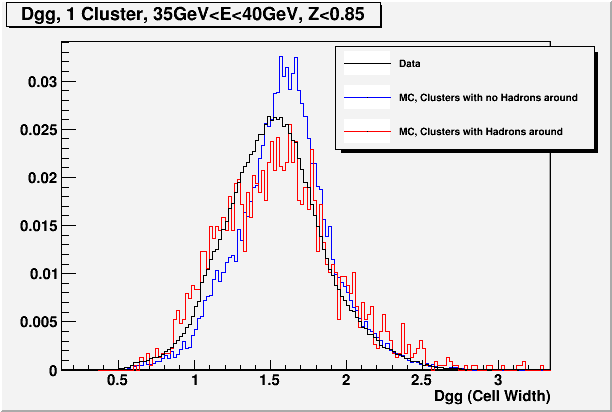
I need more statistics to study the effect of the hadronic background systematically.
I have also tried adding 10% cell width smearing on the X and Y position, as opposed to smearing the separation. This has a very similar effect on the Pi0 peak, but as expected it does not smear the Eta peak nearly enough. Interestingly, though, it produces M vs E slope for the 1 cluster case that mimics the data much better.
Fig. 4. 2 Cluster Mass in Energy Bins with X and Y 10% smearing
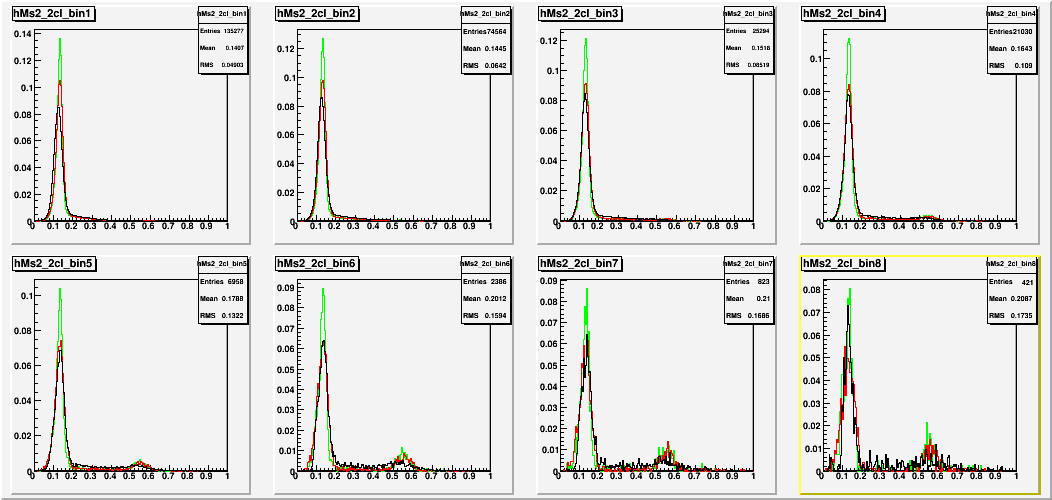
Fig. 5. 2 Cluster Mass in Energy Bins with X and Y 10% smearing, Eta region
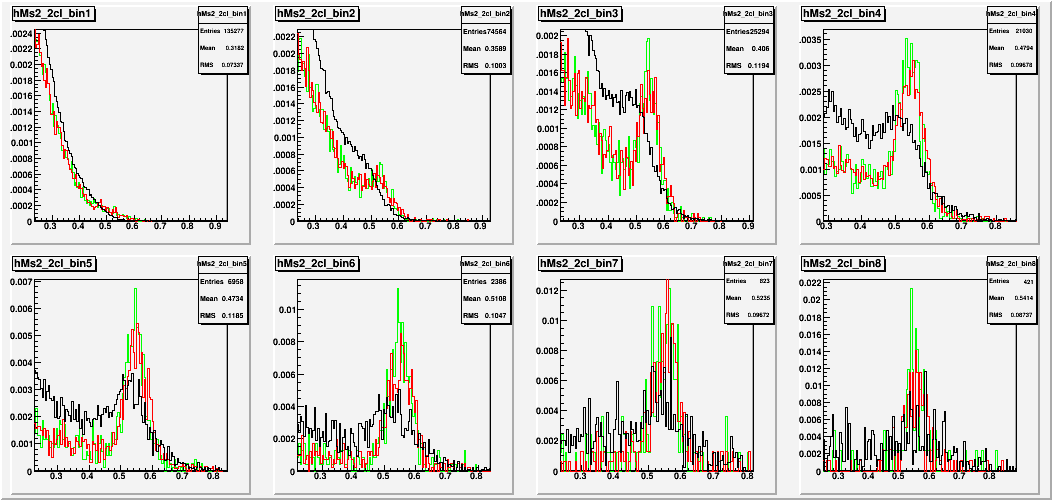
Fig. 6. 1 Cluster Mass vs. E with X and Y 10% smearing
- leun's blog
- Login or register to post comments
