FMS meeting 20101120 - Rad-hard Glass?
Akio has informed me that the first 3 columns of the east FPD are made out of rad-hard glasses. As anyone that has looked at these would know, they are visibly yellowish, suggesting that indeed we get a shift in absorption curve, although we don't know exactly how much.
The current theory is that higher attenuation of the optical lights lead to greater energy dependence and the wider shower shape. To test this theory, I've looked at these two quantities for the first 3 columns and the rest separately.
Fig. 1. Energy dependent mass shift, near side vs. far side.

Surprisingly, we don't see the pattern we expect. If anything, the far side seems to exhibit greater energy dependence. One possibility that I thought of was that this could be due to the difference in shower shape between near and far affecting the separation differently, as I used one shower shape to reconstruct them all. If the far side shape is narrower than the shower function, then it would tend to overestimate the separation at high E.
For comparison, here is what the pi0 only simulation looks like for 2 clusters.
Fig. 2. GSTAR M vs. E, Cerenkov shower, near side vs. far side
.gif)
So perhaps it's normal for the far side to be a bit more steep, but it still doesn't explain why we don't see the effect of rad-hard glasses.
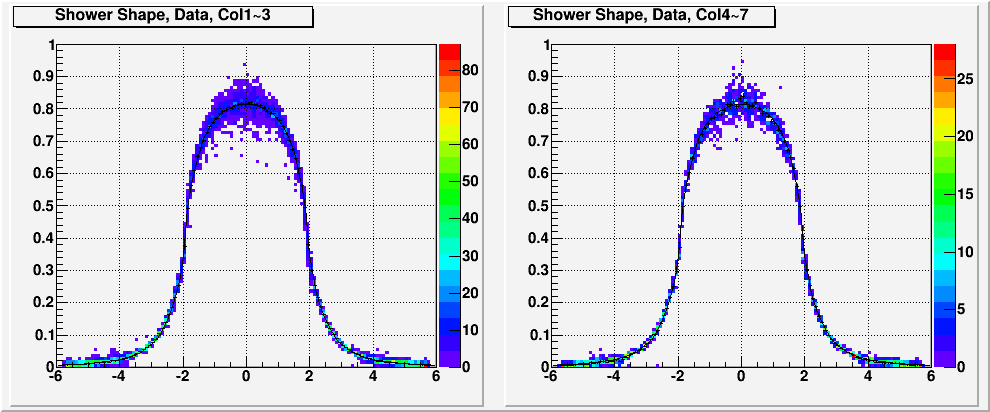
Now we look at the shower shape.
Fig. 3. Shower shape, near vs. far

Black line indicates the fit to data shower shape for all columns, and is the same for both panels. Apparently, the shower shape is basically identical for near and far. This result is incompatible with our theory about the effect of attenuation on shower shape, unless the difference in attenuation between rad-hard and regular glasses is small compared to the overall scale of the total attenuation.
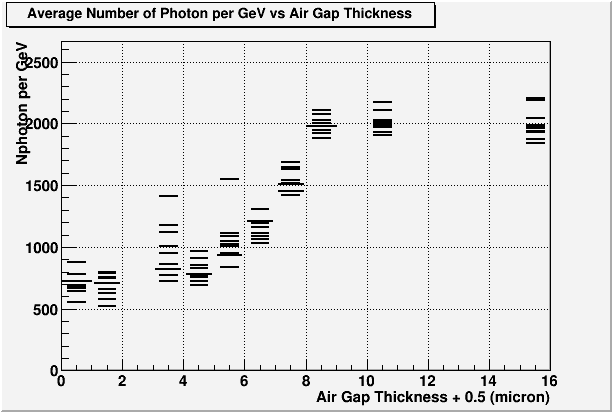
Another thing I've learned about the GSTAR is that the airgap in fact is not digital. There seems to be a dependence of attenuation on the width of the airgap, up to a certain point.
Fig. 4.

Each group at a particular gap thickness only has ten events, but it should be enough to illustrate the effect. What I've done is that I've put a box of air in between the box of Al and Pb glass, after making the Al box larger by the desired thickness of air. Steve is rather skeptical of this result, as he sees no such effect in his Geant 4. Since I currently know of no way to really visualize what's going on, I'm not too sure of what's going on here either.
In any case, it seems like if I put in 7micron of airgap all around, I get a shower shape that is similar to the data.
Fig. 5. Shower shape in GSTAR with 7micron gap, black line is data fit.

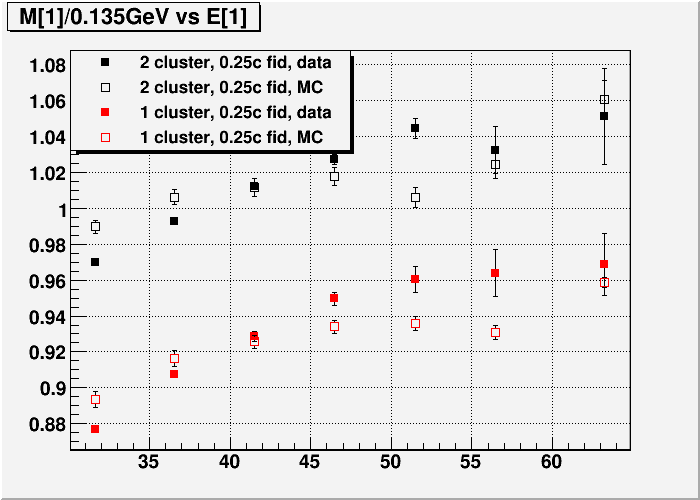
The resulting energy dependence looks like this.
Fig. 6. M vs. E, data and MC.

Hollow points are simulation, as usual.
- leun's blog
- Login or register to post comments
