- leun's home page
- Posts
- 2013
- 2012
- December (2)
- October (3)
- September (2)
- August (1)
- July (4)
- June (4)
- May (2)
- April (3)
- March (5)
- February (5)
- January (5)
- 2011
- December (3)
- November (3)
- September (5)
- August (2)
- July (2)
- June (3)
- May (4)
- April (4)
- March (2)
- February (4)
- January (2)
- 2010
- December (2)
- November (3)
- October (3)
- September (5)
- August (6)
- July (2)
- June (4)
- May (3)
- April (4)
- March (4)
- February (2)
- January (4)
- 2009
- 2008
- October (1)
- My blog
- Post new blog entry
- All blogs
FMS meeting 20101025
Shower Shape based on Cerenkov part 2
The big surprise that Steve found was that there is now a real energy dependence in the photon energy. This seems to depend on all kinds of details regarding the absorption, reflection, and quantum efficiency. We decided that the best we can do for now is go by the NET paper and charge forward.
Using those values, here is what single photon energy as a function of energy looks like. All this uses summed energy, using an ad-hoc factor to turn number of photons into energy. No reconstruction is involved.
Fig. 1. Summed / Thrown E vs. E for single photons using Cerenkov shower
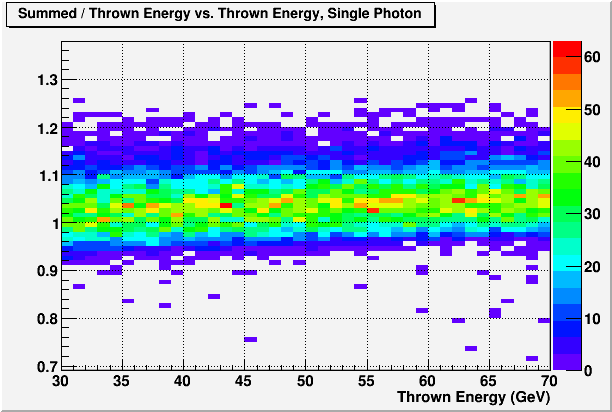
Fig. 2. Y-projection of the previous plot for 30~40GeV. Notice ~5% resolution.
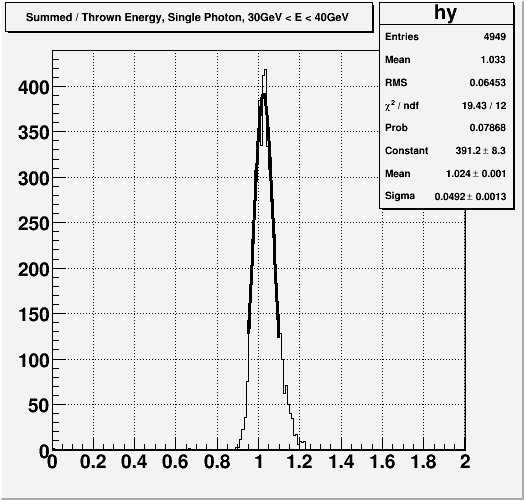
Fig. 3. Same as figure 1, but with the original energy loss shower.
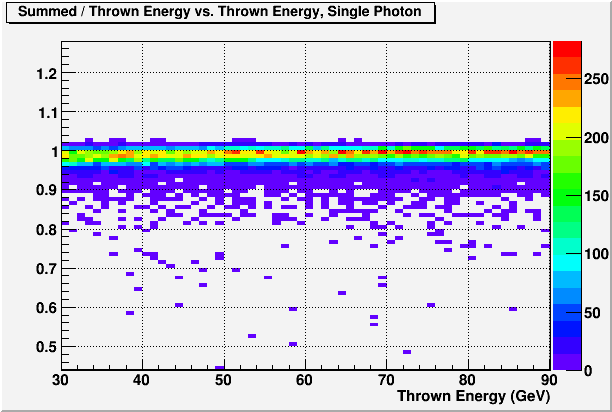
Fig. 4. Same as figure 2, but with energy loss shower. Notice ~1.3% resolution.
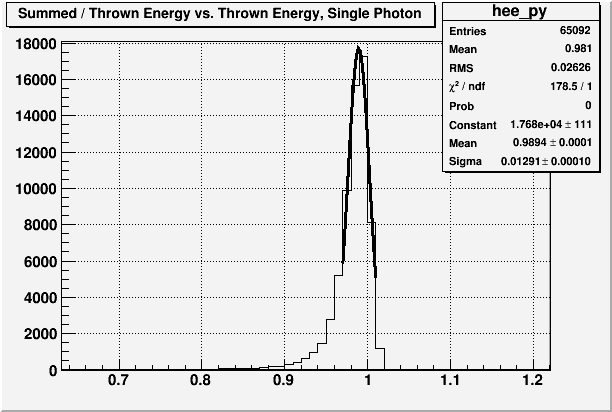
So we not only pick up energy dependence, we also have significantly reduced energy resolution.
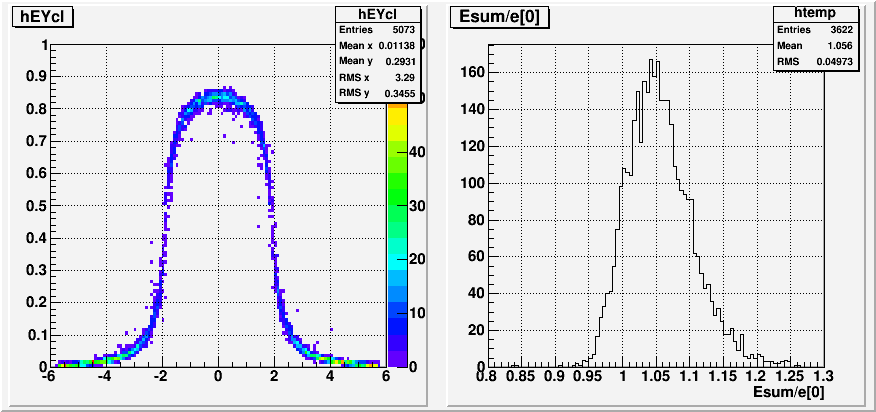
With the Cerenkov tracking, path length becomes an important factor as it affects both absorption and reflection. This means that the previous method of constructing the longitudinal structure of the shower has to be re-thought. Previously, I reduced the length of the FPD cells to look at the parts of the shower that develop in different Z-segments of the Pb glass. With energy loss, this works fine since there is no propagation, and no ambiguity in the overall energy scale. But with Cerenkov, the problem is that knowing how many photons were generated in each segment is not enough. We also need to know how many of them reached the photo cathode, which depends on the rest of the glass.
Without thinking about this, I did a bone-headed thing and tried the previous method. For what its worth, here are the results.
Fig. 5. 10cm block
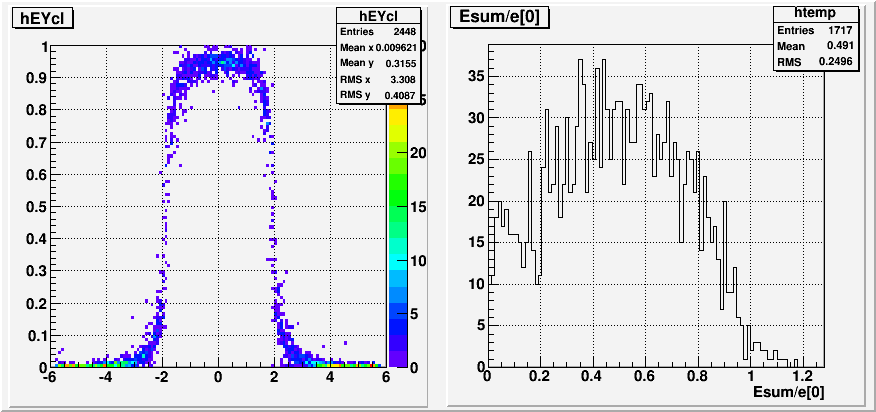
Fig. 6. 20cm block
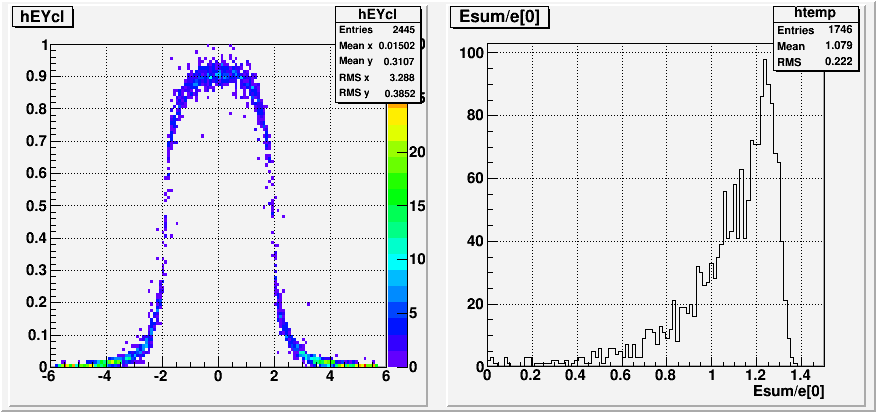
Fig. 7. 30cm block
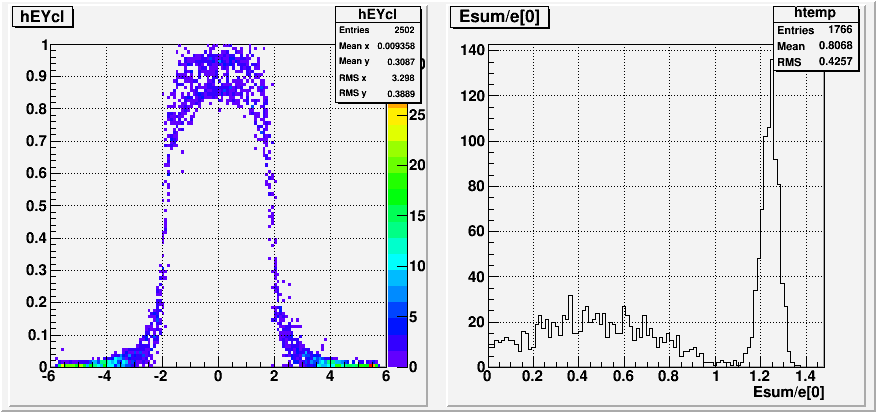
Fig. 8. 45cm block, but with incident angle. This is not exactly apples to apples compared to the previous 3 plots.
The current plan is then, instead of varying the glass length, to go into the Pb glass tracking process, and kill off all the Cerenkov photons that were generated in the region that I am NOT interested in. This way, I should be able to see the longitudinal structure including the effects produced by the full tracking.
- leun's blog
- Login or register to post comments
