- leun's home page
- Posts
- 2013
- 2012
- December (2)
- October (3)
- September (2)
- August (1)
- July (4)
- June (4)
- May (2)
- April (3)
- March (5)
- February (5)
- January (5)
- 2011
- December (3)
- November (3)
- September (5)
- August (2)
- July (2)
- June (3)
- May (4)
- April (4)
- March (2)
- February (4)
- January (2)
- 2010
- December (2)
- November (3)
- October (3)
- September (5)
- August (6)
- July (2)
- June (4)
- May (3)
- April (4)
- March (4)
- February (2)
- January (4)
- 2009
- 2008
- October (1)
- My blog
- Post new blog entry
- All blogs
20100912 FMS meeting - Data Shower Function Corrected
CORRECTION: Shower Shape in the Data
In the last meting, I claimed that the shower shape in the data seemed to be consistent with the simulations, despite the previous evidence and hints to the contrary. I was wrong. It only looked similar because I was using the reconstructed energy to divide each cell, instead of the cluster energy.
When done right, previous suspicion that the Geant having a wider shower shape than the data turns out to be true. Furthermore, the data shows much a larger fluctuation in the shape than Geant, especially at the center. Those events that we saw where 90% of the photon energy were real.
Fig. 1. Shower Shape Distribution in Data with Shower Function. BLACK: Default function, RED: Simulation fit, YELLOW: New data fit
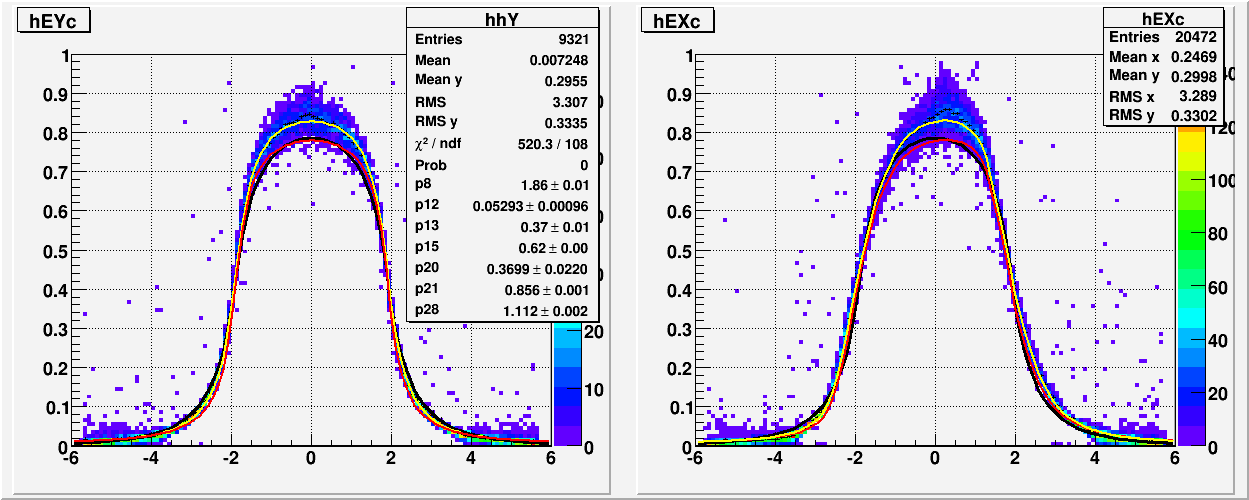
This is a very bad news indeed, especially the fluctuation. The different shape can be accommodated by re-fitting, but the large fluctuation seen in the highest towers will have to be dealt with in the error calculation. I spent days looking for a short cut, but it seems that without a serious re-working of the error function (at the minimum), the reconstruction in the data will not be anywhere near as robust as the simulation.
Using the newly-fit shower function, we can look at some of the pathologies of a bad shower-shape/error-function. (The data has been re-calibrated using the new shower shape)
Fig. 2 Reconstructed position uniformity
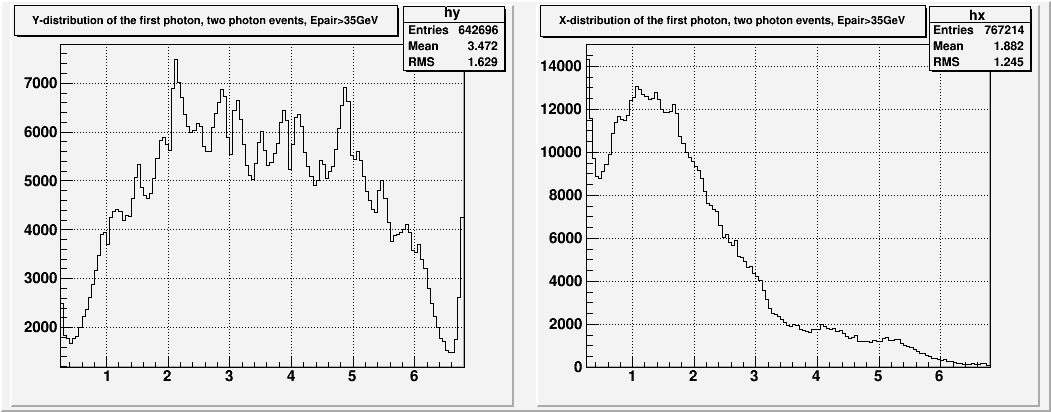
Fig. 3. Mass vs. Energy. The hollow points are the old shower shape, and solid points are new. (Calibrations are quite different, so never mind the absolute offset)
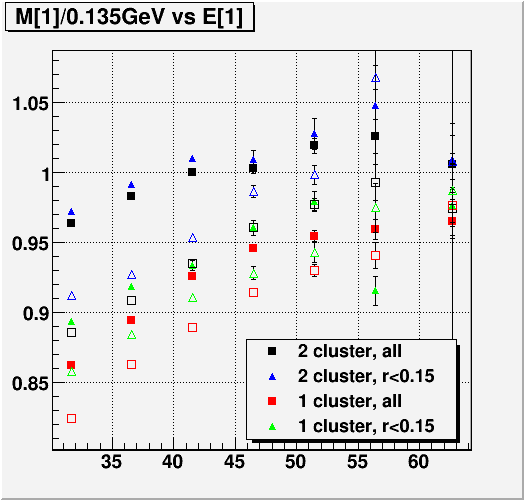
On both issues, the new shape is a noticeable improvement over the old, although it's far from the flat position uniformity and M vs. E that we now get in the simulation.
However, in some ways the new shape does worse than the old one, in that it creates a strong decay angle dependence in reconstructed mass.
Fig. 4. Decay angle dependence of the di-photon mass for 35GeV<E<40GeV found in the data using the fit-to-data shower shape. (Ave. Dgg ~1.5 cell)
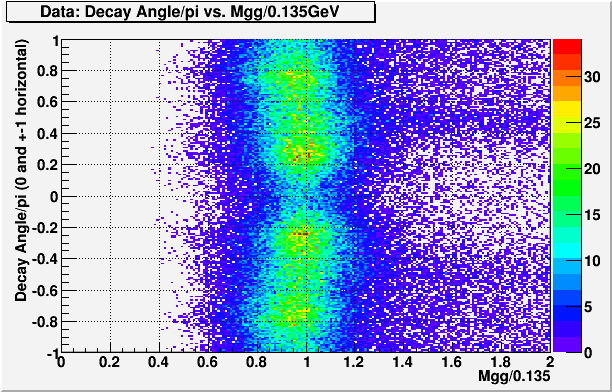
This is very puzzling, and it obviously destroys the confidence in the usual calibration process. It seems that the shape is (has to be) better than the default in many ways, but it becomes very sensitive to the topology already at this ~1.5cell separation. The inadequate error function may have a lot to do with this as well.
Turns out, a qualitatively similar effect had been seen in the simulation as well. The worst case happened when I was playing with various shower shapes, and tried something that I thought was obviously "wide". (Although at this point it's clear that "narrow" and "wide" is too simplistic.) Although the shape isn't exactly the same, and the magnitude is smaller, it's quite likely related to what we see in the data.
Fig. 5. Decay angle dependence of the di-photon mass, energy, and separation for 35GeV<E<40GeV found in MC using "wide" shower shape.
.gif)
As can be seen here, the energy is still rock solid, and the effect is all coming from (once again) the separation. So for now, this is my working assumption; That the effect we see in the data is also due to the separation, not the energy.
The best I can do to check this assumption is to look at the ratio between reconstructed energy and summed energy away from the edge in the data. Certainly the decay angle dependence is an artifact of the reconstruction, and there is no reason why summed energy should depend on it. And away from the edge, up to a factor, the summed energy should track the thrown energy quite well.
Fig. 6. Decay angle dependence of Erecon / Esum for 35GeV<E<40GeV found in the data using the fit-to-data shower shape. (Ave. Dgg ~1.5 cell)
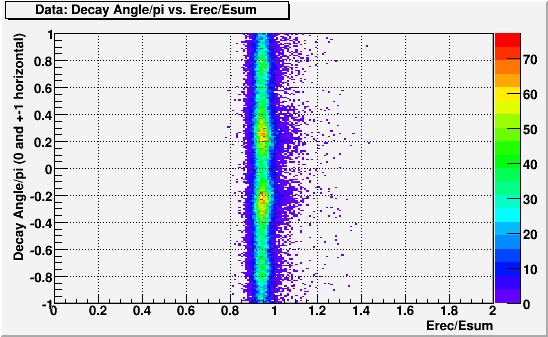
And indeed we don't see any evidence of angle dependence, supporting the idea that the dependence comes from the separation.
Before we started working on the reconstruction, I had variety of MC-based corrections that I was applying to the data. They were,
1. A complicated hybrid scheme had been used for the energy depending on the photon location. Mixture of corrected/uncorrected, cluster/reconstructed energy had been used for the 4 different "zones".
2. 2-cluster energy had been corrected as a function of separation.
3. 1-cluster photon separation had been corrected as a function of separation.
4. X-coordinate had been corrected as a function of photon energy.
At this point, all of these have been removed. With the exception of #3, there are evidences that with the newer shower shapes, the corrections are not needed even in the data. Certainly in the MC, all of these symptoms have been eliminated by the correct shower shape.
In order to proceed, with the short term goal of measuring the cross-section ratio, we take the point of view that this angle dependent separation can also be dealt with by ad-hoc correction. As long as it does not affect the energy, it just needs to be corrected to a point where pi0-mass calibration can be used.
The obvious problem with this is the normalization. We can take out the angle dependence by hand, but normalized to what? But this is a problem that only affects the overall energy scale, not the gain uniformity in the detector. For the cross-section ratio, we are not very sensitive to it.
- leun's blog
- Login or register to post comments
