- leun's home page
- Posts
- 2013
- 2012
- December (2)
- October (3)
- September (2)
- August (1)
- July (4)
- June (4)
- May (2)
- April (3)
- March (5)
- February (5)
- January (5)
- 2011
- December (3)
- November (3)
- September (5)
- August (2)
- July (2)
- June (3)
- May (4)
- April (4)
- March (2)
- February (4)
- January (2)
- 2010
- December (2)
- November (3)
- October (3)
- September (5)
- August (6)
- July (2)
- June (4)
- May (3)
- April (4)
- March (4)
- February (2)
- January (4)
- 2009
- 2008
- October (1)
- My blog
- Post new blog entry
- All blogs
20100912 FMS meeting - Calibration
Current Status of Calibration
As noted in this page, I am now applying an ad-hoc correction to take out the angle dependence of the separation. While this leaves large uncertainty in the overall energy scale, it is no worse than where we were before. Furthermore, for the cross-section ratio measurement, we primarily care about the gain uniformity.
Figuring out the normalization for the separation correction was really more art and science. First I chose some value, and iterated using the normal procedure. Then I looked at the following things in both data and MC to determine the normalization factor for the correction function.
1. Pi0 mass at lower energy: Dangerous because of the trigger threshold, but larger separation presumably gives you better handle on the separation.
2. Separation distribution in energy bins: We know that the separation resolution in the data is much worse than in MC, but still the most probable separation of pi0 events for a given energy interval should be useful in comparing the energy scale for MC vs. data.
3. Eta mass: Statistics limited, and also at the edge, but the separation should not be a problem.
Luckily, all of these gave me a consistent factor for the correction.
To enhance gain uniformity further, I brought in cross-section based correction similar to what's done in the FMS, but simplified.
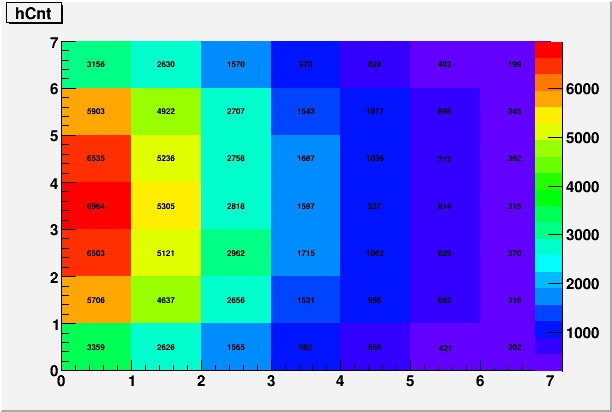
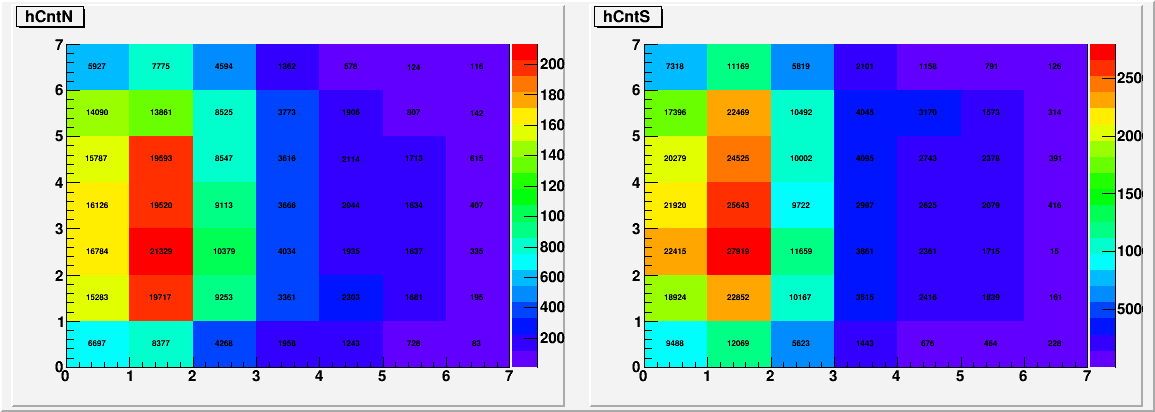
Given the expected/measured cross-section of ~Exp[-0.2E], ~0.5GeV change in energy can change the counting rate by ~10%. Based on the counting rate of photons with E>35GeV, additional correction was generated by comparing the simulation and data. In order to avoid forcing the pythia cross-section on the data, however, I normalized the counting rate by the column, where each column is similar in Eta. I also used only ~50% of the counting rate based correction combined with the full mass based correction, making it a small change around the existing scheme.
Fig. 1. Pythia based counting rate for photons with E>35GeV

Fig. 2. Counting rate for photons with E>35GeV in data, after ~5 iterations

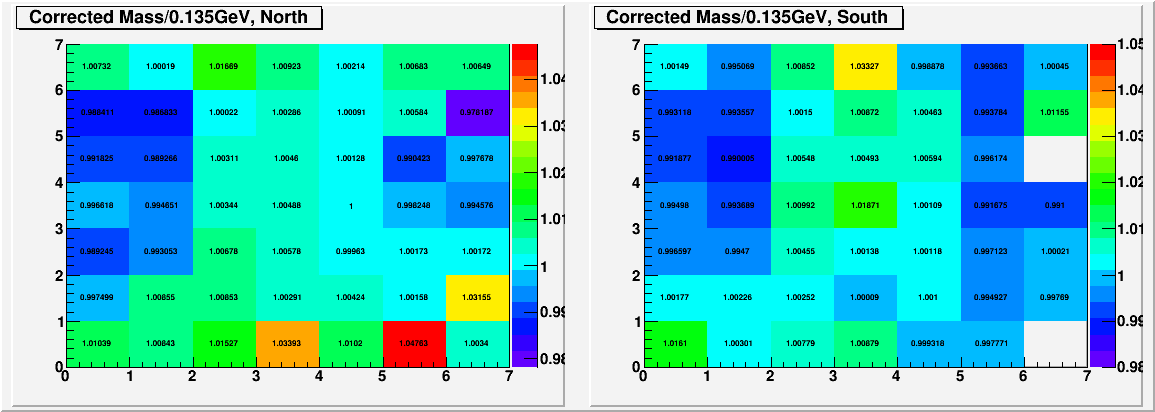
Fig. 3. Reconstructed mass distribution for events with E>35GeV and 2 clusters in data

- leun's blog
- Login or register to post comments
