- leun's home page
- Posts
- 2013
- 2012
- December (2)
- October (3)
- September (2)
- August (1)
- July (4)
- June (4)
- May (2)
- April (3)
- March (5)
- February (5)
- January (5)
- 2011
- December (3)
- November (3)
- September (5)
- August (2)
- July (2)
- June (3)
- May (4)
- April (4)
- March (2)
- February (4)
- January (2)
- 2010
- December (2)
- November (3)
- October (3)
- September (5)
- August (6)
- July (2)
- June (4)
- May (3)
- April (4)
- March (4)
- February (2)
- January (4)
- 2009
- 2008
- October (1)
- My blog
- Post new blog entry
- All blogs
20100912 FMS meeting - Calibration
Current Status of Calibration
As noted in this page, I am now applying an ad-hoc correction to take out the angle dependence of the separation. While this leaves uncertainty in the overall energy scale, it is no worse than where we were before. Furthermore, for the cross-section ratio measurement, we primarily care about the gain uniformity.
Figuring out the normalization for the separation correction was really more art and science. First I chose some value, and iterated using the normal procedure. Then I looked at the following things in both data and MC to determine the normalization factor for the correction function.
1. Pi0 mass at lower energy: Dangerous because of the trigger threshold, but larger separation presumably gives you better handle on the separation.
2. Separation distribution in energy bins: We know that the separation resolution in the data is much worse than in MC, but still the most probable separation of pi0 events for a given energy interval should be useful in comparing the energy scale for MC vs. data.
3. Eta mass: Statistics limited, and also at the edge, but the separation should not be a problem.
Luckily, all of these gave me a consistent factor for the correction.
To enhance gain uniformity further, I brought in cross-section based correction similar to what's done in the FMS, but much simplified.
Given the expected/measured cross-section of ~Exp[-0.2E], ~0.5GeV change in energy can change the counting rate by ~10%. Based on the counting rate of photons with E>35GeV, additional correction was generated by comparing the simulation and data. In order to avoid forcing the pythia cross-section on the data, however, I normalized the counting rate by the column, since each column is similar in Eta. I also used only ~50% of the counting rate based correction combined with the full mass based correction, making it a small change around the existing scheme to smooth out the structure in Phi. At the end, the additional correction due to this method is around 1~2% for the vast majority of cells, except for the few in the back.
Fig. 1. Pythia_GSTAR counting rate for photons with E>35GeV (trigger simulated)
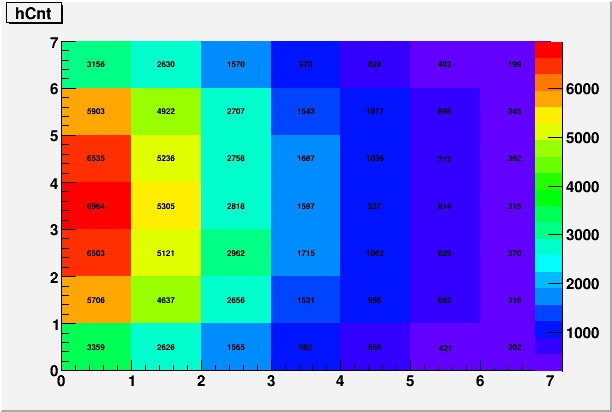
Fig. 2. Counting rate for photons with E>35GeV in data, after ~4 iterations with counting rate correction
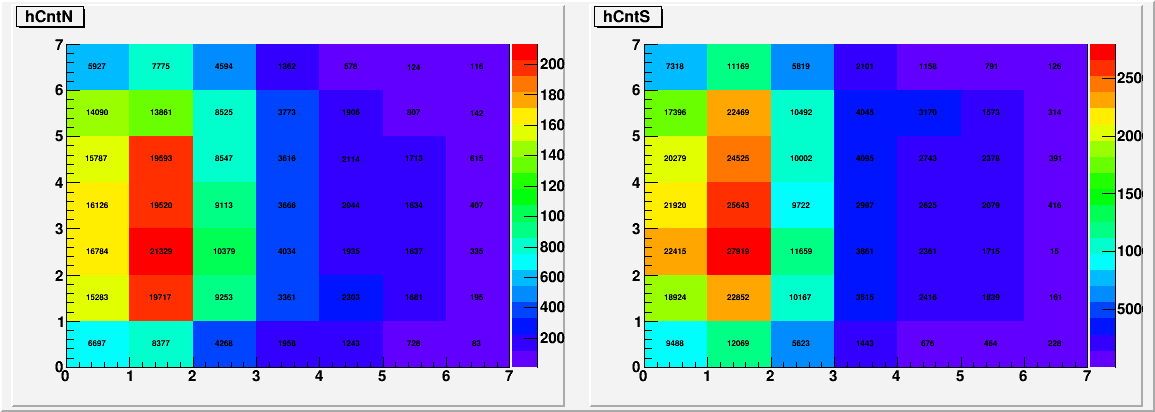
The counting rates are obviously not exactly the same with the MC, but keep in mind that ~1% change in gain equals ~10% change in counting rate. Also, we have no reason to think that pythia would give us the right Eta dependence. And compared to what we had in the past, the Phi-dependence of the counting rate is an improvement. As for the difference between the 1st and the 2nd column, here I am counting events within the fiducial cut, and more events fall outside of the fiducial cut in the data than in the MC, which at least partially explains the difference.
Fig. 3. Reconstructed mass distribution for events with E>35GeV and 2 clusters in data (Rows are reversed, with row=0 at the top)
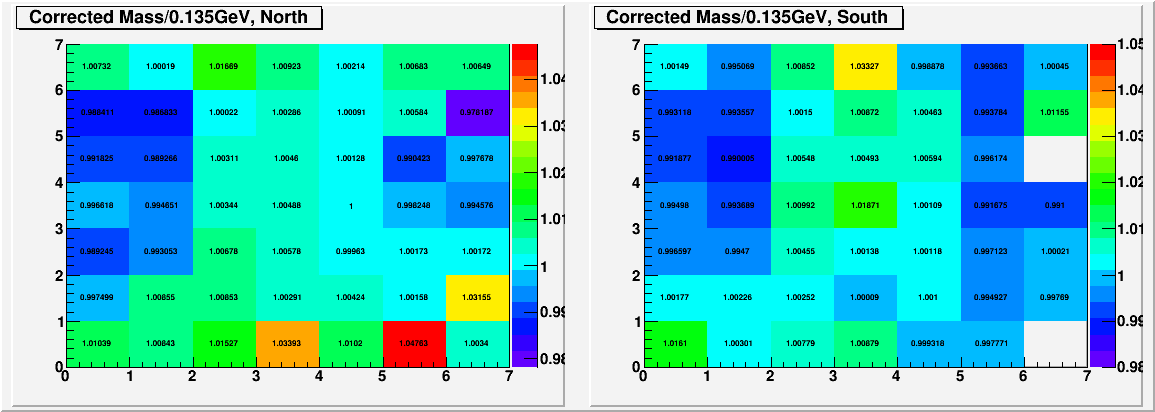
There is a very small (~0.5%) systematics in the mass distribution between the first two columns and th rest, and it will certainly benefit from a couple more iterations. But overall, the masses don't show any evidence of large Eta-dependent shift.
At this point, the relative calibration for most of the detector seems to be in a reasonable shape. The far end of the detector could use a bit more attention, and that requires running more of the data set, which is time consuming. We do care about those cells for the Eta mesons, but not for Pi0s. But even for the Etas, the last column contributes fairly minor portion of the events.
Fig. 4. Which columns the Eta events are coming from

Fig. 5. Photon locations for Pi0 and Eta events with E>55GeV and center cut, FPD EN
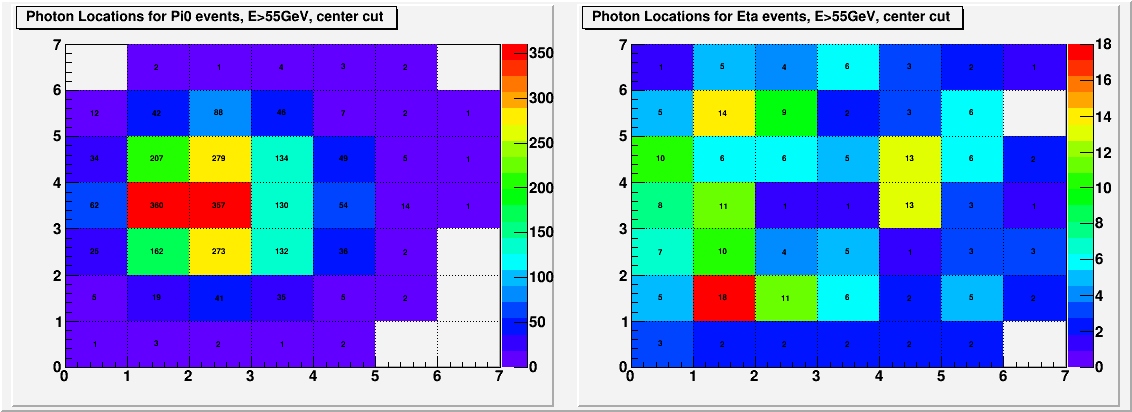
Fig. 6. Eta vs. Phi for 2 photon events, (Pi0 dominated) E>45GeV, EN
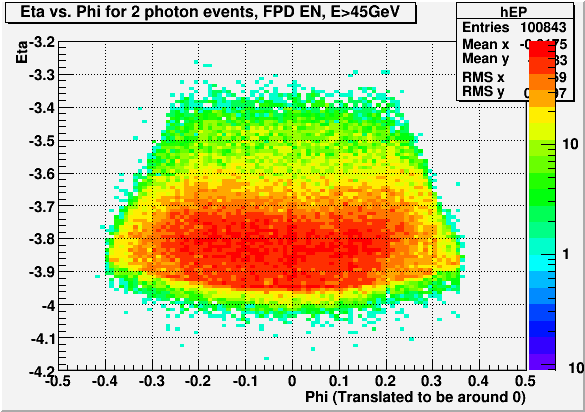
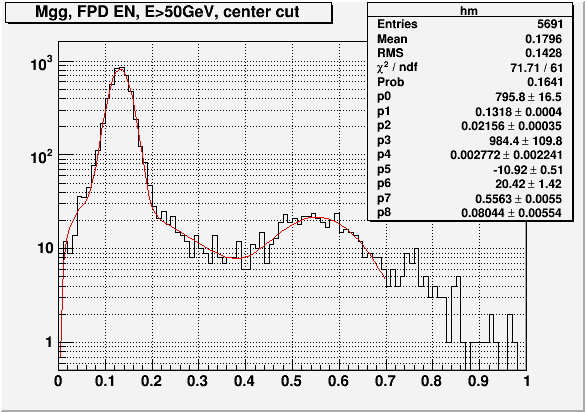
Fig. 7. Mgg distribution, E>50GeV, Center cut, EN
- leun's blog
- Login or register to post comments
