- leun's home page
- Posts
- 2013
- 2012
- December (2)
- October (3)
- September (2)
- August (1)
- July (4)
- June (4)
- May (2)
- April (3)
- March (5)
- February (5)
- January (5)
- 2011
- December (3)
- November (3)
- September (5)
- August (2)
- July (2)
- June (3)
- May (4)
- April (4)
- March (2)
- February (4)
- January (2)
- 2010
- December (2)
- November (3)
- October (3)
- September (5)
- August (6)
- July (2)
- June (4)
- May (3)
- April (4)
- March (4)
- February (2)
- January (4)
- 2009
- 2008
- October (1)
- My blog
- Post new blog entry
- All blogs
FPD 06 X-section ratio energy systematics study
FPD 06 X-section Ratio Systematics Study
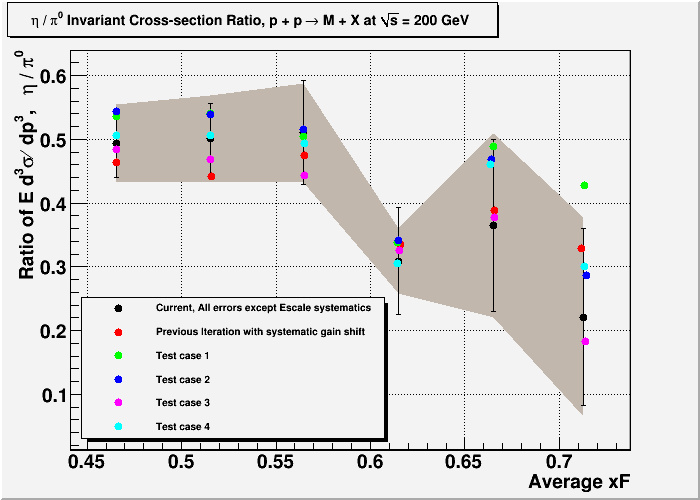
As Steve suggested, I've looked at a few "likely worst" cases of systematic gain shifts from the current calibration to see the effect of such changes in the X-section ratio. The goal of this study was to find out how much cancellation still exists when the errors in the gain calibration produce systematic patterns across the detector.
The cases used for this estimation tend to be quite extreme, so I believe that considering them to be 1 sigma type effects as I am doing here is still quite conservative.
First, the result. The grey band is the proposed energy scale systematics at this point, which is equivalent to 1% relative scale uncertainty for the first 4 points, and then 2% for the 5th and 3% for the 6th point. The main reason that the high xF bins get much larger error is because this type of systematics tend to couple to statistics. Large statistics allow sampling of wider regions of the detector, aiding the cancellation. Highest xF events, on the other hand, tend to be more localized, and therefore more susceptible to calibration induced errors.
Fig. 1. X-section ratio variation due to cell by cell gain shifts. Grey area is the newly proposed energy scale systematics based on this study.
The following is the details of each test cases.
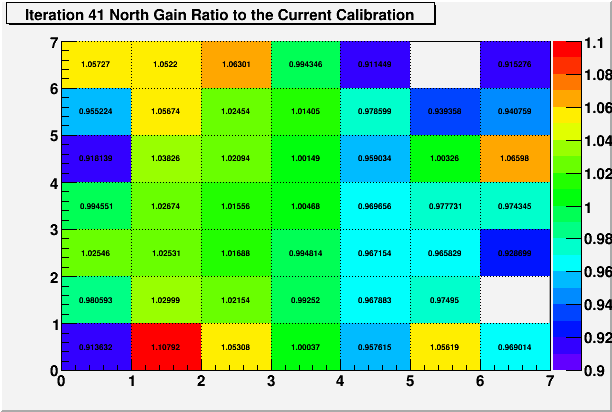
After looking at various previous iteration results, I've picked one that is wildly different from the current one with a very noticeable systematic pattern. (This one had not converged, and I was fiddling with corrections) It is clear that the back of the detector is calibrated to be much colder, and the very first column is also cold.
Fig. 2. Iteration 41.
In fact, I suspect that the most likely pattern that could emerge is the one in which column 1~2, 3~4, and 5~7 behave differently. This is because I actually use slightly different correction functions for these three regions. I try to look at the types of decay that, according to the simulation, is the most consistent across the detector, but at the end there could still be relative difference of ~1%. To test the effect of this type of pattern, I generated the following bias and applied it to the current calibration with 1% random variation. It has a severe, 2% shift in the three regions, along with 2% edge effect.
Fig. 3. Test case 1
.gif)
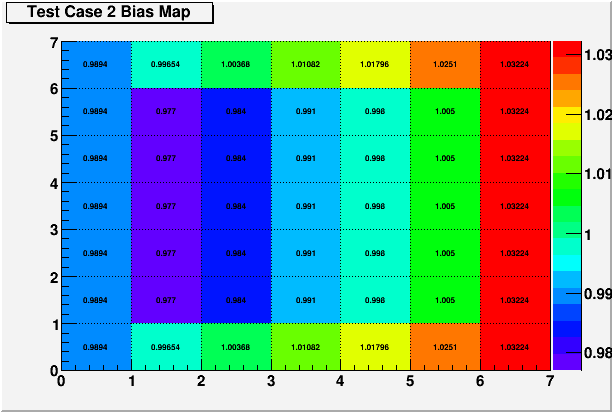
Another pattern that is also likely is a gradual shift from the front to the back of the detector. This type of bias can come from the incident angle effect coming in gradually for two photon separation. Here again, I tested a severe case with edge effect thrown in.
Fig. 4. Test case 2
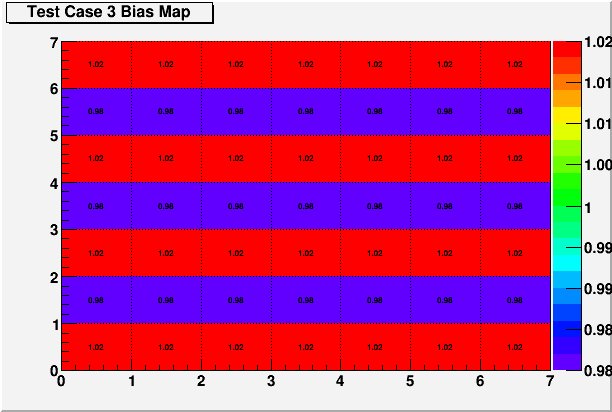
Vertical biases are probably less likely, but due to my general reliance on vertical decays, it's possible that there can be an even-odd pattern along the Y-direction. If there is, it should still be fairly localized and within 1% or so, otherwise the counting rate would look very strange. Nonetheless, we test this type of pattern by using the following rather extreme bias.
Fig. 5. Test case 3
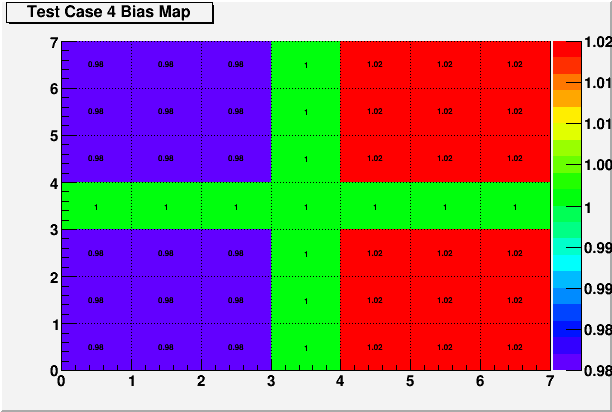
Finally, I've tried the following bias just to try something strange.
Fig. 6. Test case 4
- leun's blog
- Login or register to post comments
