- leun's home page
- Posts
- 2013
- 2012
- December (2)
- October (3)
- September (2)
- August (1)
- July (4)
- June (4)
- May (2)
- April (3)
- March (5)
- February (5)
- January (5)
- 2011
- December (3)
- November (3)
- September (5)
- August (2)
- July (2)
- June (3)
- May (4)
- April (4)
- March (2)
- February (4)
- January (2)
- 2010
- December (2)
- November (3)
- October (3)
- September (5)
- August (6)
- July (2)
- June (4)
- May (3)
- April (4)
- March (4)
- February (2)
- January (4)
- 2009
- 2008
- October (1)
- My blog
- Post new blog entry
- All blogs
More on mass spectrum
Data vs MC Mass Spectrum comparison
Continuing the discussion that was first addressed with my response1.pdf, I have tweaked a few things.
Before, I corrected the eta-pi0 ratio in Pythia to be 50% for all energy. Now I set it to 45%, which given the measurement accuracy is as good as any other number in this ballpark region.
As before, the normalization is done so that data and simulation have the same number of events in the pi0 mass region.
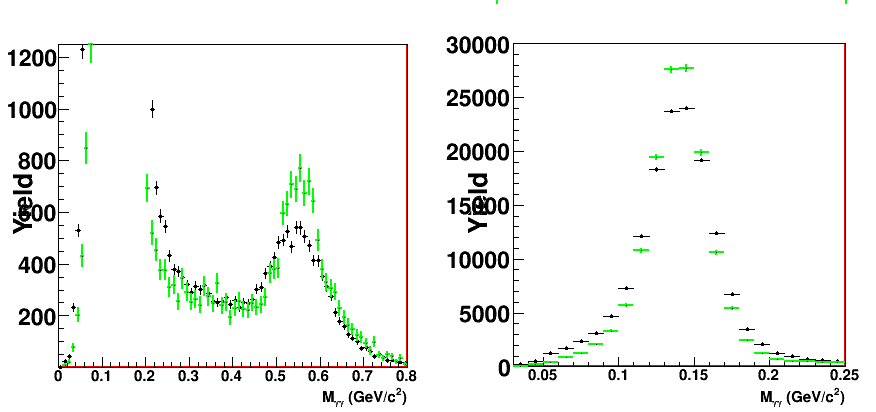
Fig. 1. Mass spectrum for E>45 GeV, eta/pi0(simu) = 0.45

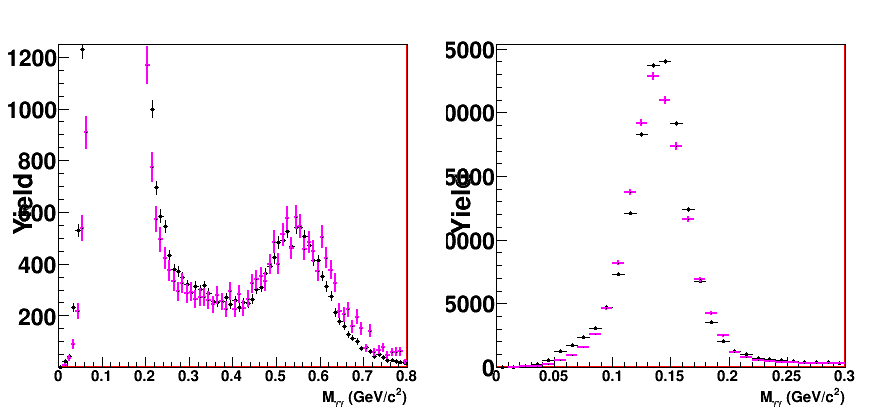
Fig. 2. Same as figure 1, but with an extra 10% smearing on mass. No extra smearing on energy.

NOTE: Fig 1 green and figure 2 magenta actually have the same number of events total. In the eta mass region (0.45 < M < 0.65), the smeared (magenta) has 93% of the events in the same mass region of the unsmeard (green). In turn, the data has 94.7% of the events in the same mass region compared to the smeared (magenta) distribution.
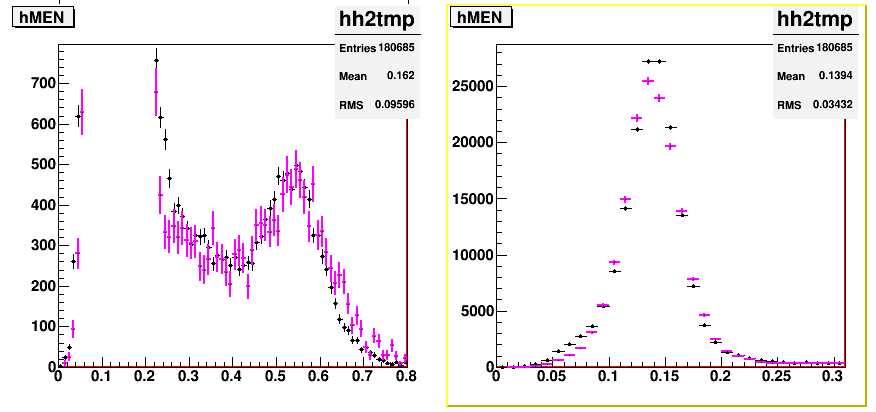
I've also made the same plot as figure 2, but now with 0.5 cell fiducial cut for both simulation and data.
Fig. 3. Same as figure 2, but with 0.5 cell (instead of 0.25 cell) fiducial volume cut

The situation does not look very different here.
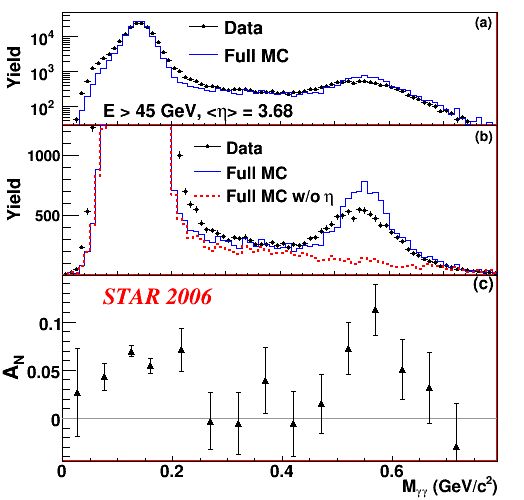
Fig. 4. Alternative Fig. 2. for the eta paper, where eta/pi0 has been set to 0.45 for all energy

- leun's blog
- Login or register to post comments
