- leun's home page
- Posts
- 2013
- 2012
- December (2)
- October (3)
- September (2)
- August (1)
- July (4)
- June (4)
- May (2)
- April (3)
- March (5)
- February (5)
- January (5)
- 2011
- December (3)
- November (3)
- September (5)
- August (2)
- July (2)
- June (3)
- May (4)
- April (4)
- March (2)
- February (4)
- January (2)
- 2010
- December (2)
- November (3)
- October (3)
- September (5)
- August (6)
- July (2)
- June (4)
- May (3)
- April (4)
- March (4)
- February (2)
- January (4)
- 2009
- 2008
- October (1)
- My blog
- Post new blog entry
- All blogs
FMS meeting 20110110 - more on energy smearing, calibration
Continuing the discussion from last week on the energy resolution issue, we now look at it in the context of calibration.
The large energy smearing means that almost every distribution that I can look at look very very different depending on whether I bin them in generated energy, or reconstructed energy. It's of course the most obvious when we look at the all important Reconstructed Energy over Generated Energy distribution.
Using the current calibration on the simulation, this is what the distribution of generated energy looks like in a particular reconstructed energy bin.
Fig. 1. E_gen for E_recon 50~55GeV
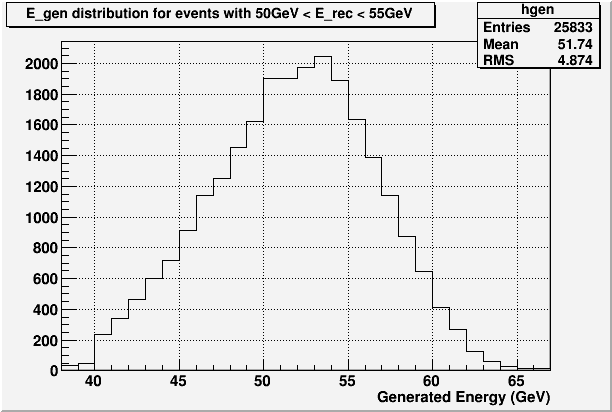
So we see that the peak is within the same bin, and apart from the large spread, it's at least symmetrical. Current method of getting the pi0 mass in the "right" place in each reconstructed energy bin results in this.
However, if we look at the reconstructed energy distribution in generated energy bin, it's a different story.
Fig. 2. E_rec for E_gen 50~55GeV
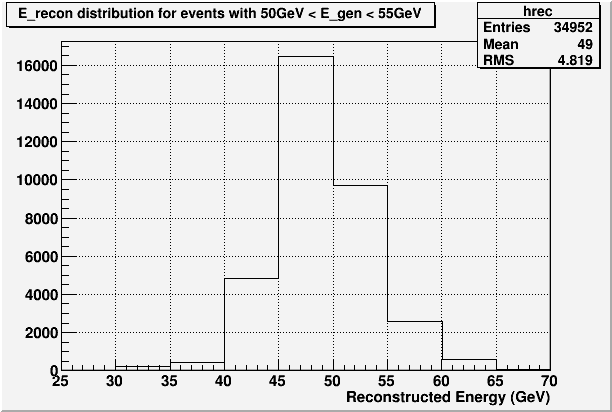
The probelm is clear. The calibration is done in reconsturcted energy bins, which would then naturally fold in the bin migration into the calibration. That is, a large fraction of the events in any given reconstructed bin is lower generated energy events with overestimated energy, which leads to the increase of pi0 mass. The calibration would tend to take this out by reducing the gain. If I look at the event by event gain at this point, it is indeed lower than ideal by 4~5%.
I can take the point of view that, after all, the calibration is specific to my current analysis, and everything can be dealt with by various corrections. For example, the bin migration can be "undone" by applying the following "reverse-semaring" matrix that maps a reconstructed energy bin onto a number of generated energy bins, and the current calibration makes it as diagonal as it can be given the energy smearing.
Fig. 3. Reverse-smearing matrix, X-axis in the reconstructed energy bin, and Y-axis is the generated energy bin.
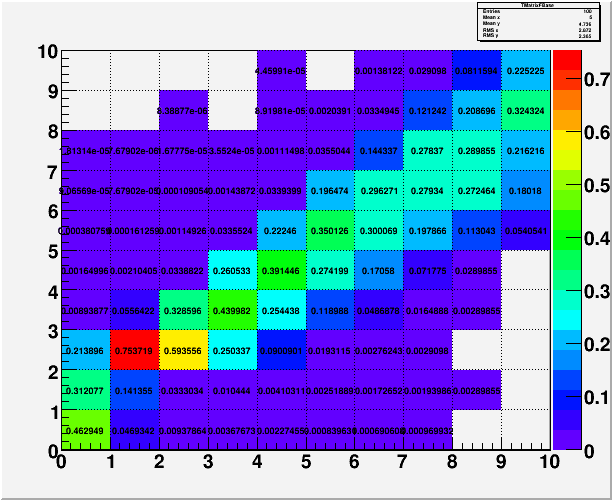
On the other hand, the true smearing matrix, the one that maps a generated energy bin onto a number of reconstructed energy bins, would be very non-diagonal right now. That would become more diagonal if I were to do an "event-by-event" calibration that does not depend on the smearing or the cross-section.
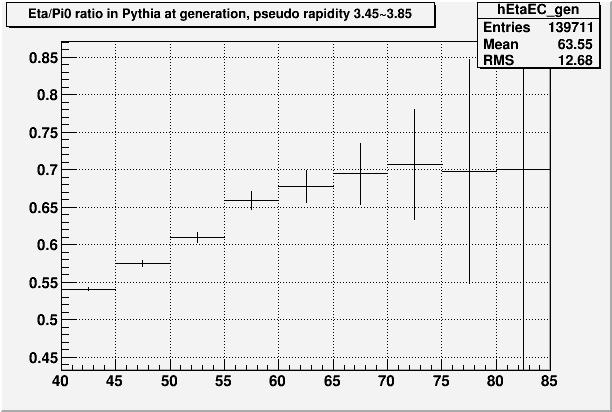
In any case, for now I charge on to look at what the cross-section looks like with all the most current things. One thing to note is that, bin by bin, the mass distribution in data and simulation matches really quite well. This suggests that the Eta-Pi0 ratio in the data should be similar to what's in the simulation, and what's in the simulation is interesting.
Fig. 4. Eta-Pi0 ratio in Pythia, counting thrown particles before GSTAR, around FPD centercut.
With very non-final corrections and poorly estimated systematics, the following is what it looks like in the data now. There are knon issues with the efficiency correction right now, which I'm working on, so please take this with a grain of salt.
Fig. 5. Current status of cross-section ratio
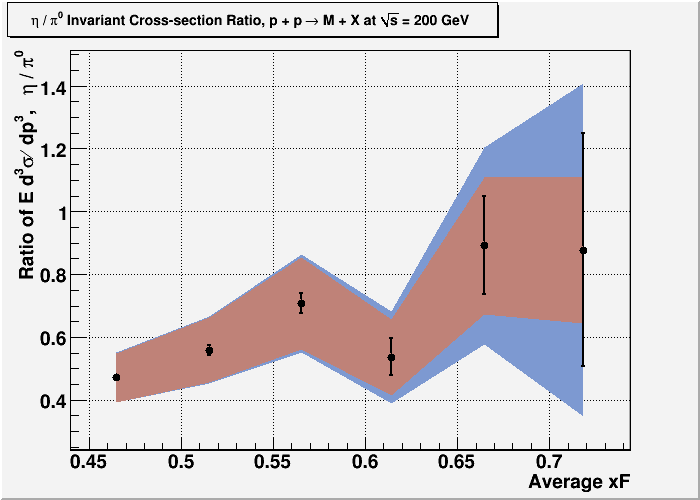
This looks very different from what we had before, and the high energy bins are very high. But then if we look at the absolute cross-section, we see what's going on.
Fig. 6. Current status of absolute cross-section
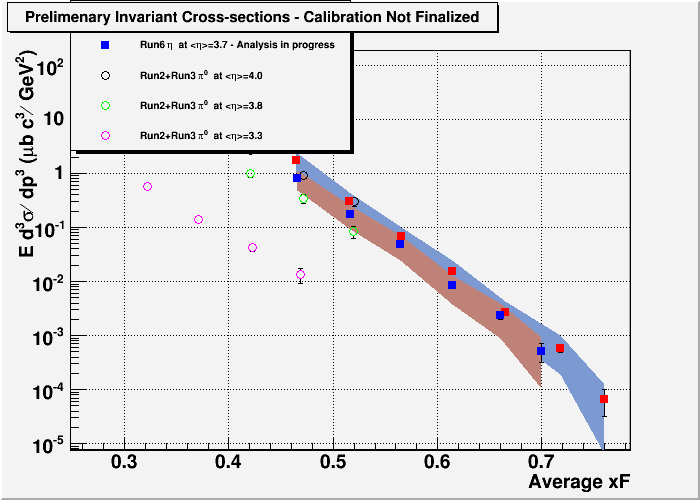
So it seems like for the high xF bins, the average energy for the Eta is just lower than the Pi0, which makes dividing on by the other not really fair. I'm not sure yet of why this is.
- leun's blog
- Login or register to post comments
