- leun's home page
- Posts
- 2013
- 2012
- December (2)
- October (3)
- September (2)
- August (1)
- July (4)
- June (4)
- May (2)
- April (3)
- March (5)
- February (5)
- January (5)
- 2011
- December (3)
- November (3)
- September (5)
- August (2)
- July (2)
- June (3)
- May (4)
- April (4)
- March (2)
- February (4)
- January (2)
- 2010
- December (2)
- November (3)
- October (3)
- September (5)
- August (6)
- July (2)
- June (4)
- May (3)
- April (4)
- March (4)
- February (2)
- January (4)
- 2009
- 2008
- October (1)
- My blog
- Post new blog entry
- All blogs
FMS meeting 20110523 - single photon
BBC veto for Single Photon Analysis
Fig. 1. BBC schematic
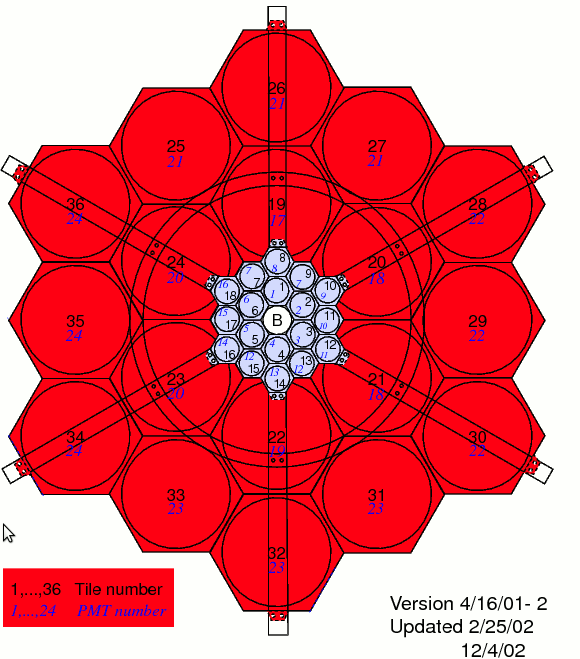
Of these, tile number 11 and 17 for the inner, and 20, 21, 23, and 24 for the outer cover the FPD in run 6.
Fig. 2. BBC coverage of the east FPD during run6 (Pi+ only GSTAR)
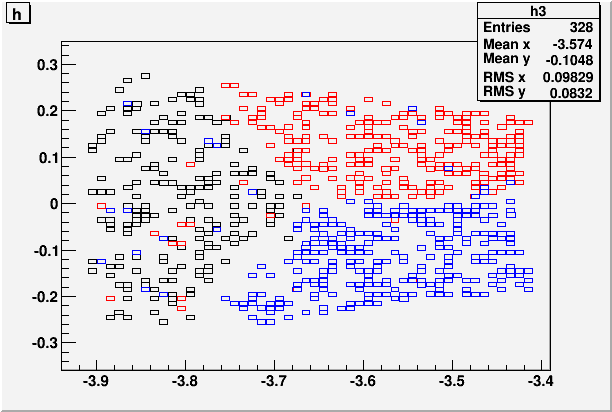
BLACK: Tile 11, RED: Tile 20, BLUE: TIle 21
So even for our original center cut, the large tiles would be necessary to cover the whole region.
The actual BBC data looks something like this.
Fig. 3. Example BBC distributions from data
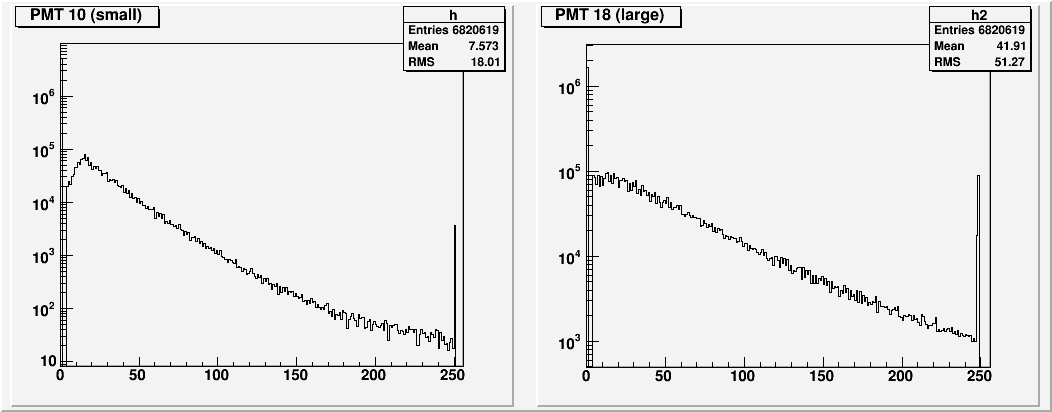
There is a clear MIP peak in the small tile, but not in the large. After playing with it, I've found that using the large as veto doesn't really seem to do anything sensible. This is unfortunate, but one tile is better than nothing, so I've decided to use one small tile as a veto.
For comparison, this is what we get from full simulation.
Fig. 3a. Example BBC distributions from Pythia + GSTAR simulation

According to Pythia + GSTAR, the signal purity and background composition with this setup is the following.
Fig. 4. Signal fraction with one tile veto, Eta reduced to 45% of Pi0 at all energy
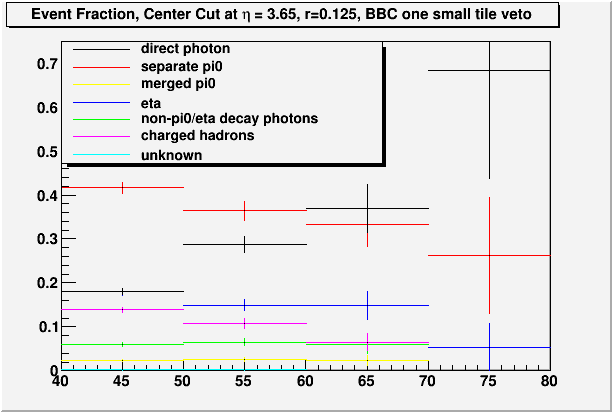
So we can expect a reasonable suppression of charged hadrons, although otherwise things look similar as before.
As a base line, the asymmetry without BBC looks like this.
Fig. 5. No BBC physics asymmetry, no correction, r=0.125 centered at eta=3.65 (ignore labels)
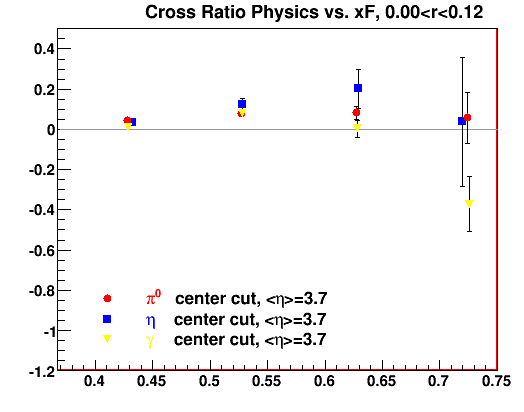
Now with one BBC tile as a veto.
Fig. 6. BBC veto, physics asymmetry, r=0.125 centered at eta=3.65 with a crude attempt at BG correction
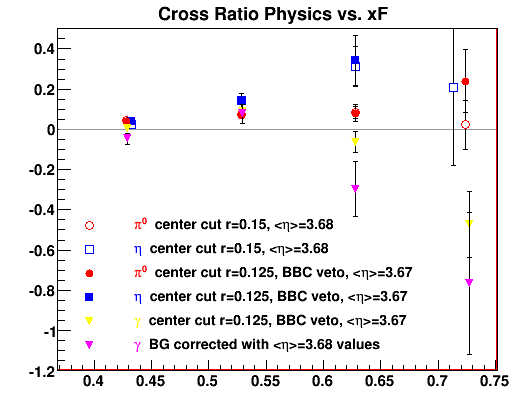
The effect is actually quite minor, and the gain is pretty much confined to the third data point. More study is in order, but this is the current situation.
The error for yellow is statistical only, while the error for magenta includes estimated systematics. However, I'm taking the simulation result at face value, and the error in BG fraction comes only from the simulation statistics.
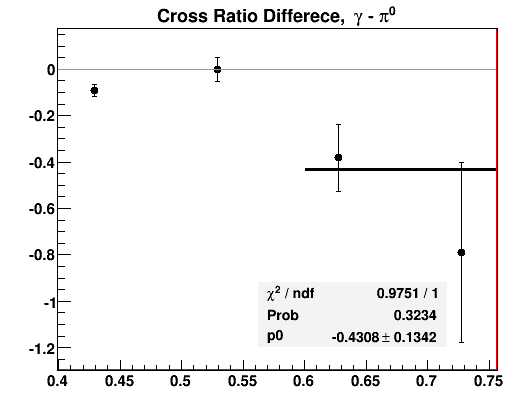
Finally, we look at the difference in analyzing power between pi0 and gamma. Correlated error introduced by the background correction has been (hopefully) factored out.
Fig. 7. A_N difference
- leun's blog
- Login or register to post comments
