- leun's home page
- Posts
- 2013
- 2012
- December (2)
- October (3)
- September (2)
- August (1)
- July (4)
- June (4)
- May (2)
- April (3)
- March (5)
- February (5)
- January (5)
- 2011
- December (3)
- November (3)
- September (5)
- August (2)
- July (2)
- June (3)
- May (4)
- April (4)
- March (2)
- February (4)
- January (2)
- 2010
- December (2)
- November (3)
- October (3)
- September (5)
- August (6)
- July (2)
- June (4)
- May (3)
- April (4)
- March (4)
- February (2)
- January (4)
- 2009
- 2008
- October (1)
- My blog
- Post new blog entry
- All blogs
Existing FPD simulation
Existing FPD Simulation Summary
The simulation that I already have is clearly not sufficient to do anything serious on the upgrade study, but it may have some value in getting us started, and giving us some ideas about what SHOULD be run.
The following is the details of the FPD simulation that I've been using for the Eta / photon analyses.
1. Only the east south FPD was simulated.
2. Pythia energy filter was set at 40 GeV for the energy sum of all particle in the vicinity of the south FPD.
3. GSTAR was run with the full Cherenkov simulation.
4. In total, the integrated luminosity is about 4pb^(-1).
Currently, half of the pythia and all of the GSTAR level outputs are available on RCAS.
Pythia: ~leun/sim/fpdsim6/export/simout3/evgen.4[2-3]????.nt.gz
GSTAR: ~leun/sim/fpdsim6/export/simout3g/fpd_run6_4[0-3]????.root
But since I rarely use these directly, I do not have a nice front end to read them in handy. However, the final physics trees, that contain the FPD photon list along with many other physics variables, still include all of the Pythia track information that exist in our Pythia output Ntuples. This is also avaibale on RCAS, and it is quite easy to use them.
The files are here.
~leun/sim/fpdsim6/export/simout3r/gTree_622_4*Chkv_bbc*root
The variable definitions can be found in my analysis note for the Eta paper.
http://drupal.star.bnl.gov/STAR/blog/leun/2011/sep/12/run-6-fpd-eta-paper-analysis-note
I've been playing with the above trees to see if I can make some sense of the jet structure in the simulation, assuming that I have information on the charged tracks. I wrote a simple C script that reads in the above trees, and produces a much smaller tree with "jet" variables in it. (I ran these on my local machine, it takes a few hours to run the entire set, which is really not necessary)
The script: ~leun/sim/fpdsim6/export/simout3r/Read_gTree3_test.C
Output Tree: ~leun/sim/fpdsim6/export/simout3r/hTest_r0.7_12ph.root
My "jets" are made up in the following way.
1. For all tracks except for photons and neutrons within -4<eta<-2.5. (Used true eta here),
2. I put in 10% gaussian smearing to the track momentum, just because I felt like I should put in something.
3. I select those tracks that are within the radius of 0.7 (again, a random choice) in eta-phi from the center of mass of the meson or photon measured by the FPD.
4. I add these lightly smeared 4 vectors of the tracks to the 4 vector of the fully simulated (through GSTAR) pi0s/photons in the FPD
5. That's my "jet".
As for the variables,
1. ph_* : what's in the FPD.
2. jet_* : For "jets".
3. mom_* The last particle in the chain of parentage for the track that deposited energy in the FPD.
4. fs_* : For the final state parton of the hard scattering that had the greatest z-momentum towards east. (most negative pZ).
5. type : Event type. You can sort out pi0s, prompt photons, and such by using this flag.
Turns out, I don't quite understand what's in the record. Following the parentage of the FPD track does not always lead me to a sensible result, namely a final state parton of the hard scatering that has about the right pT and energy to fragment into my track. I suspect it's because once you reach the string, which is where pretty much everything originates, sometimes parentage gets murky. It could also be that the way Pythia record is saved according to Les/Akio's code has some peculiarity that prevents me from doing this all the time, but I don't know this yet.
On the other hand, if I just look at the final state parton of the hard scattering and match the pT and energy, that works out better. But still, in many cases I see that there's nothing that really matches my FPD track, in which case I assume what I got was from the underlying event. As you can guess, I have not studied these in depth, so these are all at some level my guesses.
So here are some plots, for the purpose of diagnostics.
Fig. 1. Jet pX vs final state parton pX. Since we only have the south FPD, pT is basically positive pX.
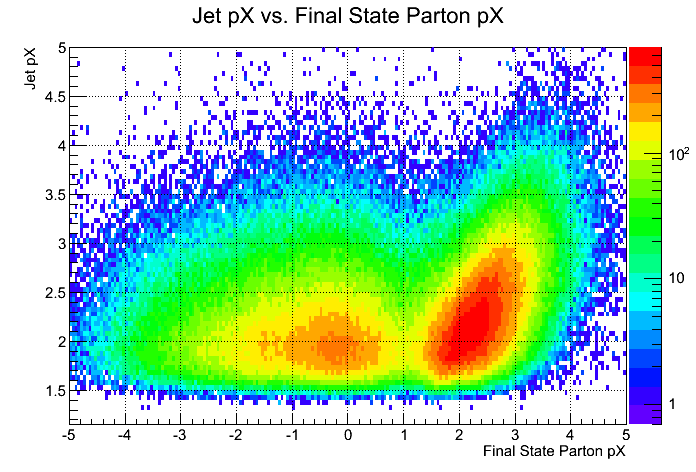
For final state parton pX (fs_pX) > 1. GeV, we have a strong correlation between the jet vector and the parton. So there can be considered hard scattered. But the events with fs_pX < 1.0 are either underlying events, or I simply picked the wrong parton to compare. The latter certainly has to be there, but not very common, as I am choosing the parton with higher pZ, and pZ is quite asymmetrical between the two FSPs for this kinematics. I wish I had saved them both in my tree though. I will do that next time.
Fig. 2. Only for fs_px > 1. GeV,
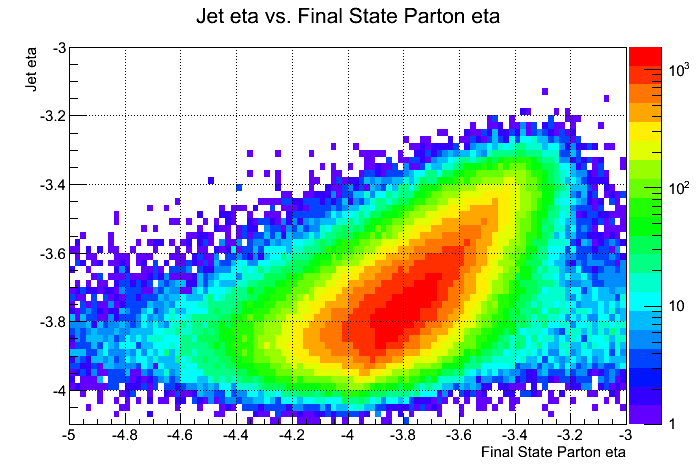
Again, we see a nice correlation between my "jet" and the parton.
However, if I look at the total energy of the jet vs. the energy of the FSP, something is wrong.
Fig. 3.
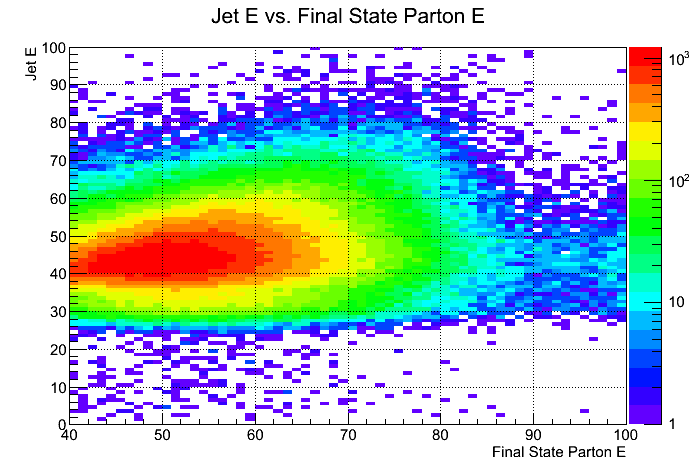
Basically the jet energy doesn't increase nearly enough as the associated parton energy increases. If we look at this fractionally,
Fig. 4.
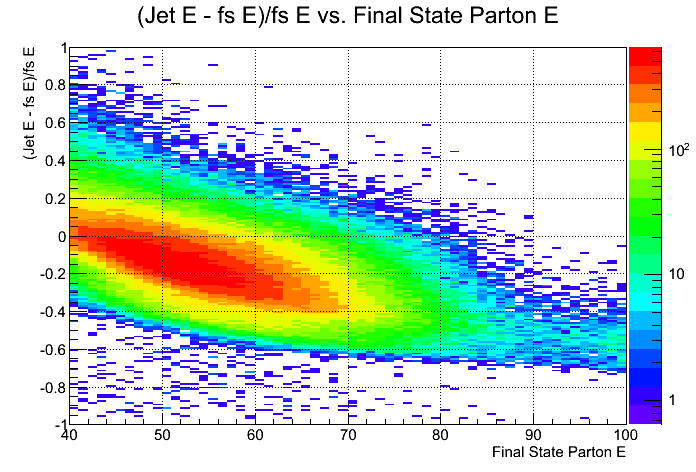
The same holds for pT.
Fig. 5.
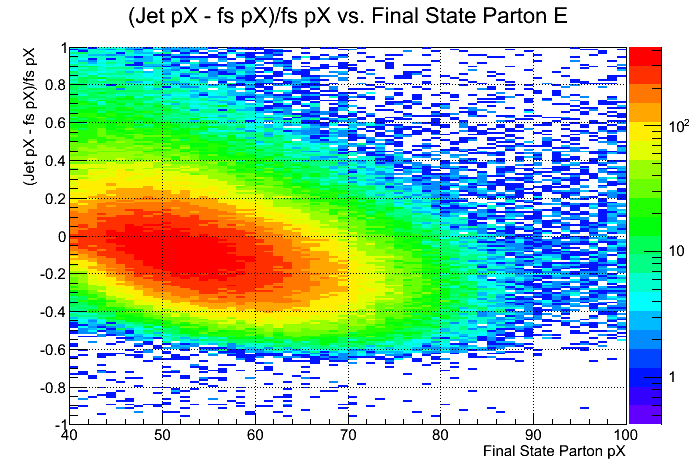
I haven't gotten to the bottom of this problem. I've tried increasing the kinematic range for the tracks to extreme values, and including photons and neutrons as well, but the problem still remains. My physics analysis trees (gTree_622*) have all the tracks that exist in the Pythia output, but I might be doing something wrong in the script I posted above.
There are other signs that I'm missing tracks.
Fig. 6. Number of charged tracks in the "jet"
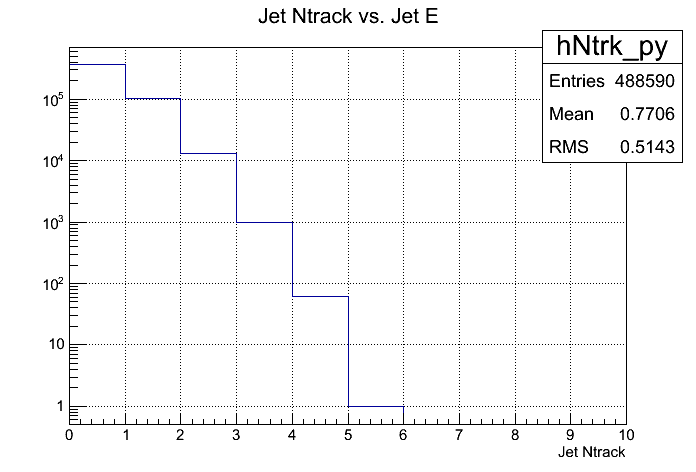
Fig. 7.
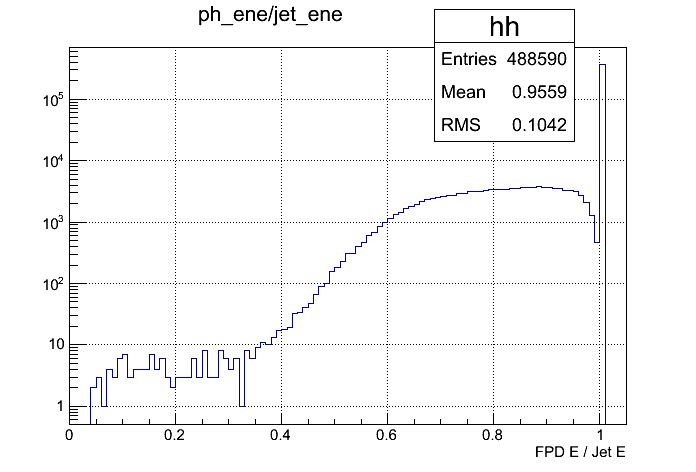
Fig. 8
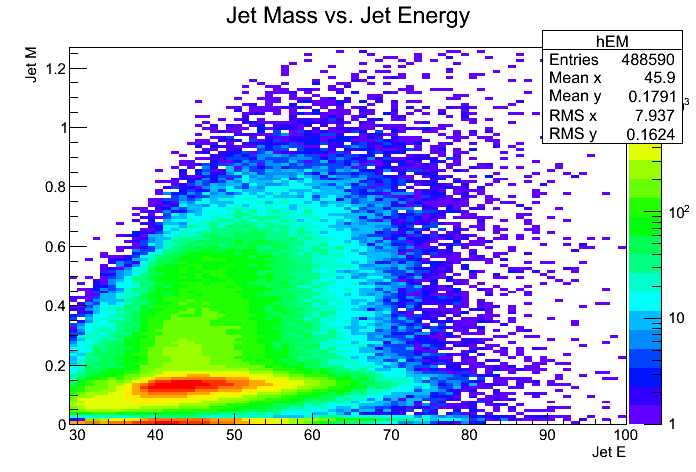
So these are really not very jetty at all. Most of the times my events do not have much other than the pi0/photon in the FPD within 0.7 radius. I don't really understand this.
So to summarize,
1. The simulation files that exist contain at least some information on tracks.
2. I have no a priori reason to believe that any tracks were thrown away at Pythia level, and yet the events are not jetty, and I'm missing energy.
3. In any case, even going by Nikola's study, we would expect these FPD triggered events to be very high z, and not terribaly jetty.
4. If we find that the tracks are there and there is some other mistake that is causing this issue, then the simulation could be useful for doing some rough estimates. For instance, we could look at what the typical occupancy would be in some eta region for a jet event that deposit energy in the FPD, which coincides with a nice meaty region of the FMS.
- leun's blog
- Login or register to post comments
