- leun's home page
- Posts
- 2013
- 2012
- December (2)
- October (3)
- September (2)
- August (1)
- July (4)
- June (4)
- May (2)
- April (3)
- March (5)
- February (5)
- January (5)
- 2011
- December (3)
- November (3)
- September (5)
- August (2)
- July (2)
- June (3)
- May (4)
- April (4)
- March (2)
- February (4)
- January (2)
- 2010
- December (2)
- November (3)
- October (3)
- September (5)
- August (6)
- July (2)
- June (4)
- May (3)
- April (4)
- March (4)
- February (2)
- January (4)
- 2009
- 2008
- October (1)
- My blog
- Post new blog entry
- All blogs
Eta x-section fiducial cut systematics
The Effect of Changing Fiducial Volume Cut to Pi0 & Eta Cross-section
Per Akio's suggestion, I repreated the cross-section analysis for pi0 and eta with the old fiducial volume cut, set at 0.5 cell from the edge as opposed to 0.25 that is used for the current analysis.
More specifically, I re-generated smearing matrix, efficiency correction, and data energy distribution with the 0.5 cell cut. This new data distribution was unfolded using the new smearing matrix, and then I applied the new efficiency correction. One thing I didn't do was to re-estimate the errors for the unfolding. But this shouldn't really change much from the old values, although it'll likely get slightly worse due to some loss of statistics.
In any case, I am primarily interested in how the mean valuse changed.
Fig. 1. Result of the new unfolding with 0.5 cell fiducial cut.
.gif)
Fig. 2. Cross-section result with 0.5 cell fiducial cut
.gif)
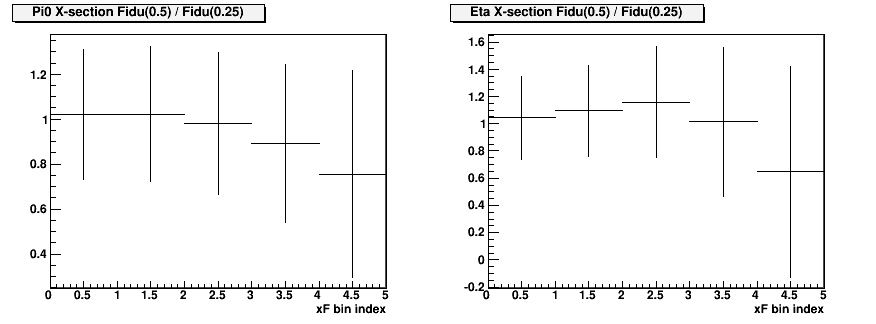
I believe the differences are within the original error bars, but I would be finee with increasing the systematic error for the ratio a bit for points above 0.55 as well, to be on the safer side.
Fig. 3. Pi0 and Eta cross-section comparison between 0.25 cell and 0.5 cell fiducial cut

Fig. 4. Ratio of the two distributions from figure 3

The problem is that the error bars for figure 4 are very much overestimated, as one uses a subset of the data used for the other. But given the unfolding process, I have no idea how I would disentangle the correlated part of the error. However, I think the result still looks quite reasonable.
- leun's blog
- Login or register to post comments
