- leun's home page
- Posts
- 2013
- 2012
- December (2)
- October (3)
- September (2)
- August (1)
- July (4)
- June (4)
- May (2)
- April (3)
- March (5)
- February (5)
- January (5)
- 2011
- December (3)
- November (3)
- September (5)
- August (2)
- July (2)
- June (3)
- May (4)
- April (4)
- March (2)
- February (4)
- January (2)
- 2010
- December (2)
- November (3)
- October (3)
- September (5)
- August (6)
- July (2)
- June (4)
- May (3)
- April (4)
- March (4)
- February (2)
- January (4)
- 2009
- 2008
- October (1)
- My blog
- Post new blog entry
- All blogs
FGT timing scan 02/08/2012
Summary of FGT Timing Scan, up to 02/08/ 2012
Currenlty, FGT data are taken in 7 time bins, with the bin width of ~27ns. (My understanding is that the total number of bins will likely be reduced to 5 or 3, but I could be wrong.)
During the first over night collision period (from day 35 ~ 39), Jan and Gerard performed a series of timing scans to find the trigger crossing. Unfortunately, during the first few days the beam had issues, for instance having beams that have not been re-bucketed from the beam study. So we ended up with mostly observing what we now know to be beam gas background synched with bunches.
We finally got a good set of data on day 39 (02/08/2012), and here I summarize the result of the first analysis of those runs. the runs were taken with varying timing latency values, where changing the latency by one unit corresponds to shifting the timing by one bin width (27ns). Jan and Gerard used ~2 bin steps for some regions, and 1 bin steps for the region where they suspected the triggered crossing resided. The data was taken with BBC min-bias trigger.
The runs used in this analysis, and their corresponding timing latency values are,
Int_t run[28]= {43, 44, 45, 46, 47, 48, 50, 51, 52, 53, 54, 55, 56, 57, 58, 59, 60, 61, 62, 63, 64, 65, 66, 67, 68, 69, 71, 72};
Int_t latency[28]= {90, 88, 86, 84, 82, 80, 78, 76, 74, 72, 70, 68, 66, 64, 92, 80, 94, 96, 98, 48, 46, 44, 79, 81, 83, 85, 87, 84};
where the two digit run numbers are the last part of the full run number 130390??.
For each pulse, pedestal was determined event by event as the lowest ADC count of the 7 time bins.
For pulses whose maximum adc count is more than 600 counts above the pedetal (minimum adc), the following function was fit.
f(t) = A * (t-t0) ^2 * exp ( (t-t0) / tau ) + C for t > t0
f(t) = 0 for t < t0
Based on this fit result, I took pulses with chi2 / dof < 2. Using these pulses,
The goal is to find the latency that puts the t0 parameter between 1.5 and 2.5 on average.
The timing can be in principle different for each APV chips. However, almost all of the APV chips present have nicely synchronized timing within a couple of time bins. So for the purpose of finding the gross timing, it is useful to integrate over all APV chips and look at the distribution of t0 parameter as a function of latency values.
Fig. 1. Normalized t0 distribution vs. latency, where normalization was done using the total number of events analyzed for each run.
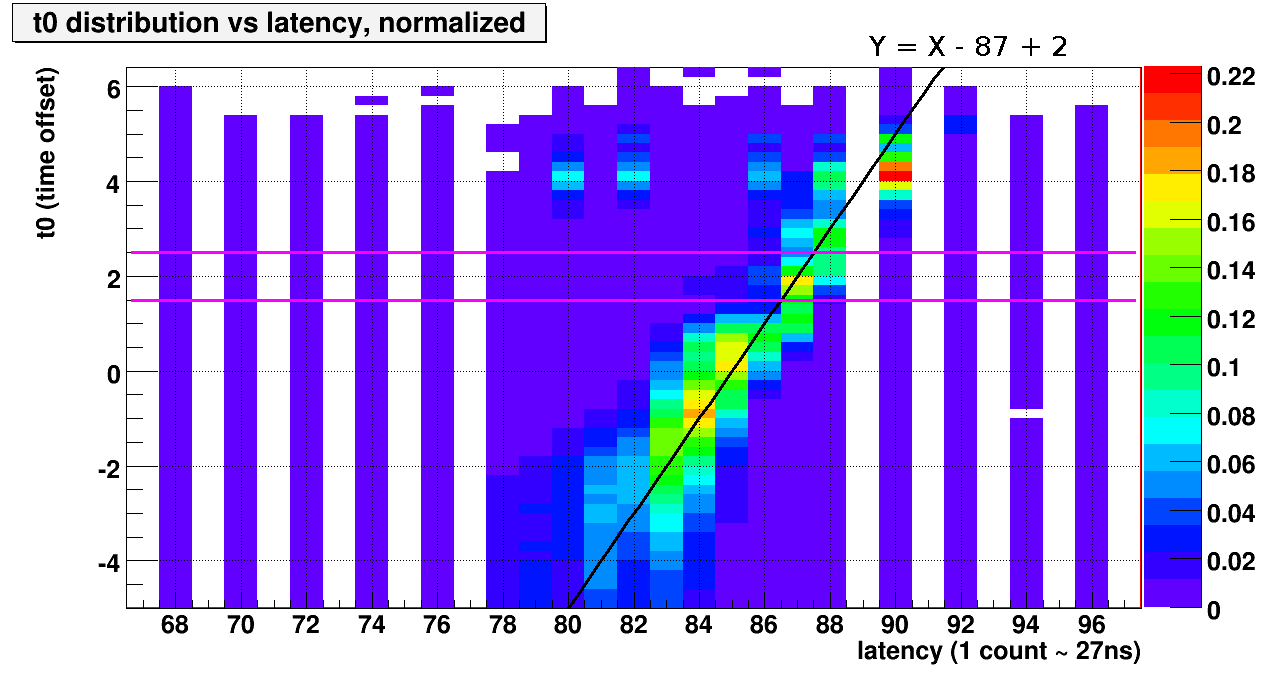
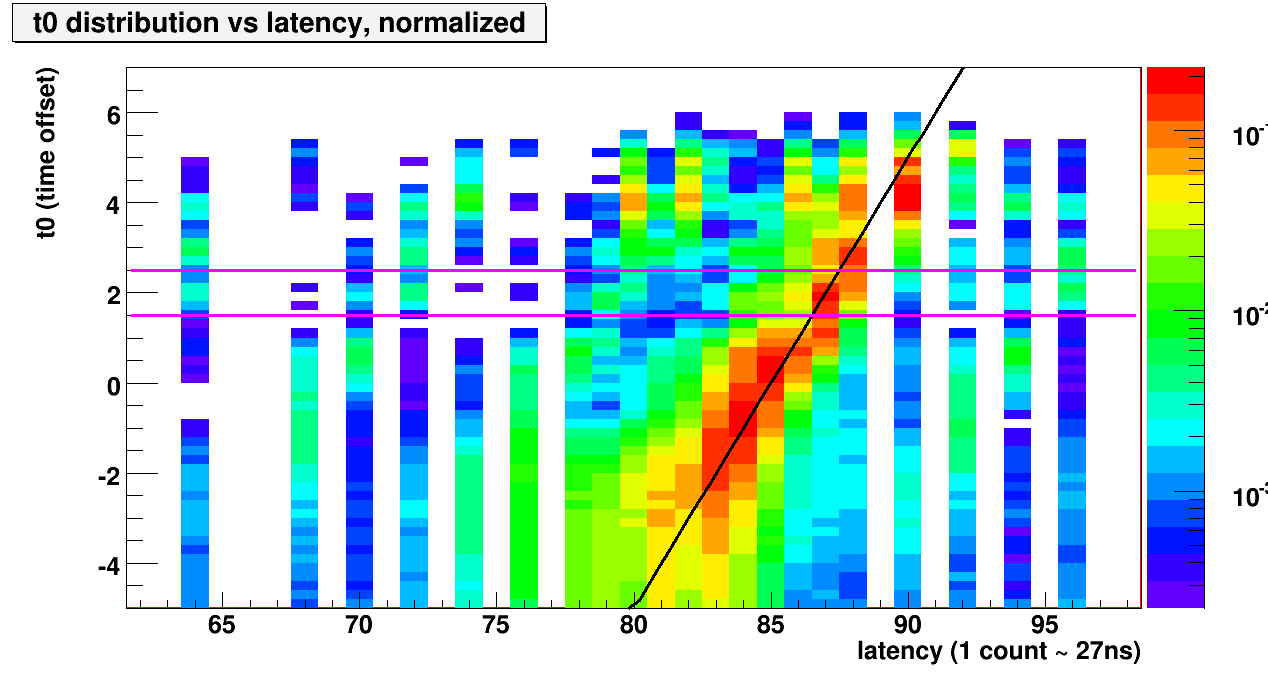
Here, we see a clear evidence that the triggered crossing has been found around the latency values of 80~90. Also shown is a linear function that demonstrates the relationshop between the latency value an the actual timing. The magenta lines indicate the boundaries for the desired t0 values. (1.5~2.5)
Fig. 1a. Same as fig 1, but in log-Z scale to look for the beam-gas background that we saw previously.
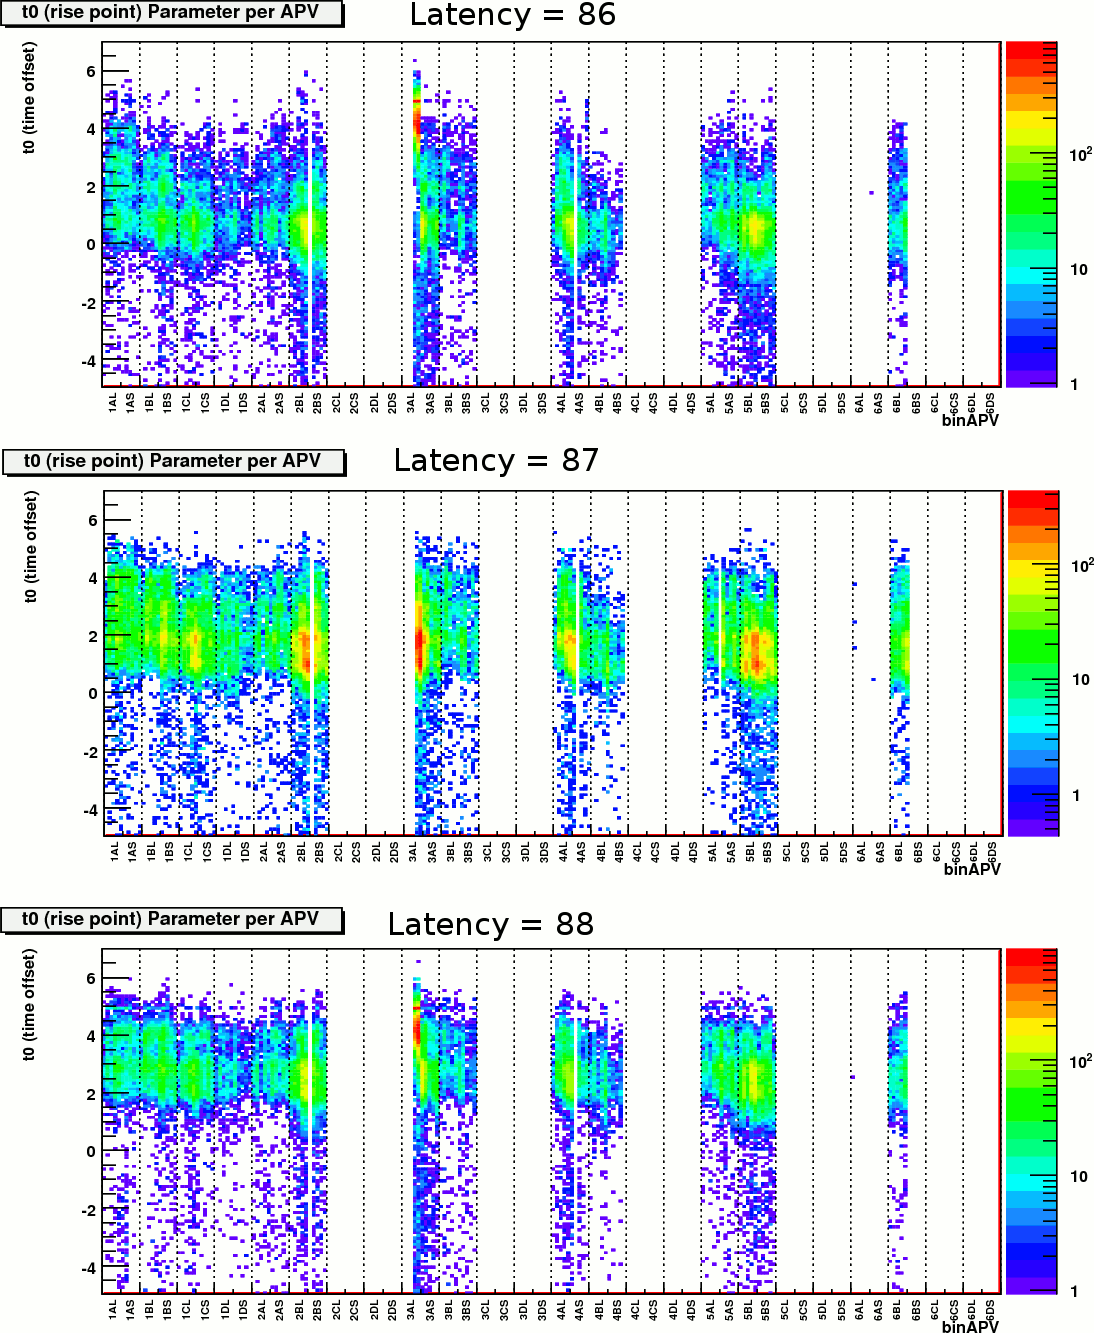
Now we look at the t0 distribution as a function of the APV chips, for the three latency values 86, 87, and 88.
Fig. 2. t0 vs. apv for 3 runs with latency 86, 87, and 88
Now we look at the fraction of events that have t0 between 1.5 and 2.5, as a function of latency and APV.
Fig. 3. Fraction of events with t0 between 1.5 and 2.5
.gif)
We conclude that the correct latency value for the overall system is 87. This value works failry well for most APVs, likely enough to allow for the next stage of calibration and detector study.
Fig. 4. The print outs of typical events using latency = 87 (PDF file for a whole lot more)
.gif)
Finally, I've looked at the APV by APV timing adjustment. Here, I take one run with latency = 87, and performed gaussian fit on the t0-distribution of each APV. If the quality of the fit ix good, then I took the gaussian centroid as the peak value of the t0 distribution. Again, we want this value to be between 1.5 and 2.5. The result of the fit can be found here, and the different colors for the plots are explained below.
Fig. 5. APV by APV, t0-gaussian fit.
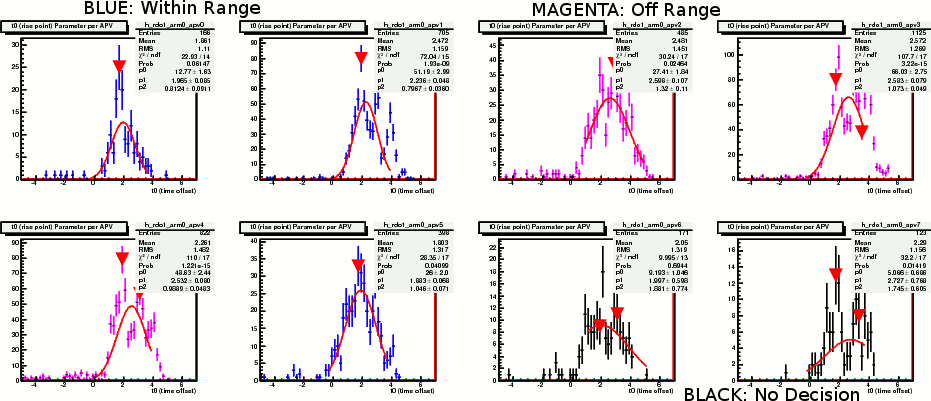
Based on this result, the following is the estimated timing for the APVs with latency = 87. The errors are not gaussian sigma, but the error of the gaussian centroid from the fit.
Fig. 6. t0 peak location vs. APV
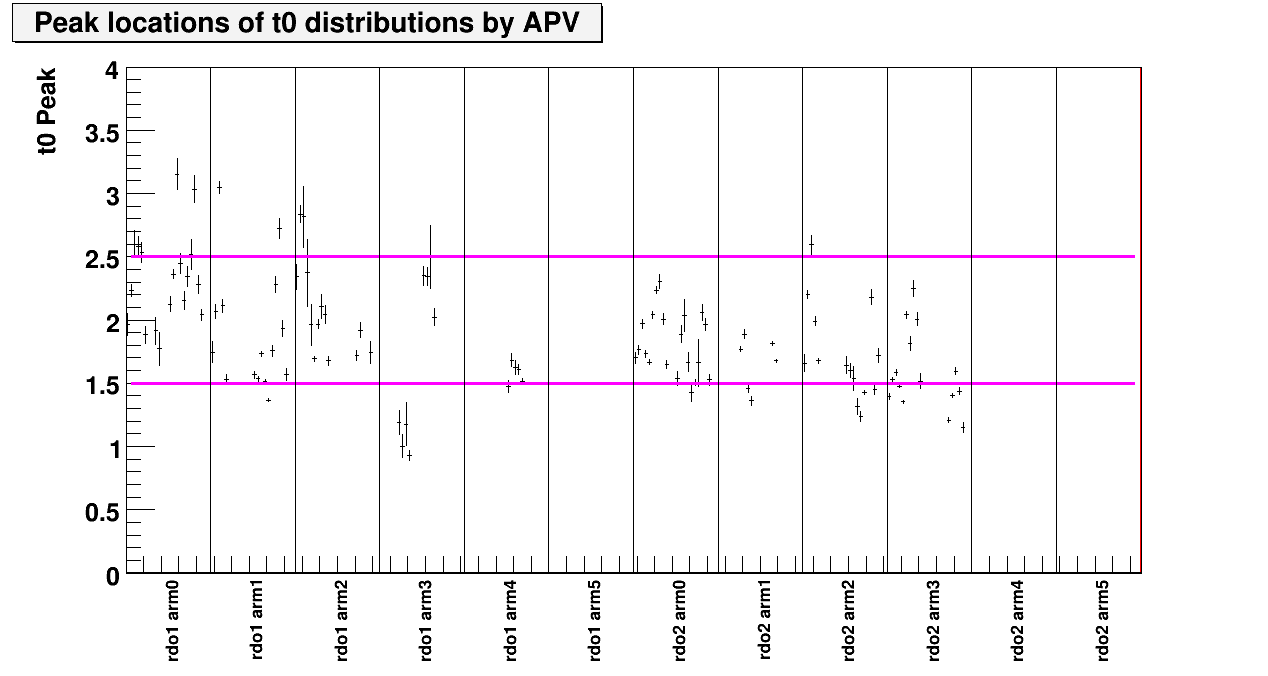
Notice that the APV index is different from previous plots, and here it is given in terms of electronics ID.
In conclusion, the timing scan of the FGT was successful, and after a few days (and nights for Jan and Gerard) of work, we found the collision crossing. Furthermore, the relative timings of the APV chips are very well synchronized, and they will need relatively minimal fiddling on the outliers to get all of them to be within range. Onward and upward!
- leun's blog
- Login or register to post comments
