- leun's home page
- Posts
- 2013
- 2012
- December (2)
- October (3)
- September (2)
- August (1)
- July (4)
- June (4)
- May (2)
- April (3)
- March (5)
- February (5)
- January (5)
- 2011
- December (3)
- November (3)
- September (5)
- August (2)
- July (2)
- June (3)
- May (4)
- April (4)
- March (2)
- February (4)
- January (2)
- 2010
- December (2)
- November (3)
- October (3)
- September (5)
- August (6)
- July (2)
- June (4)
- May (3)
- April (4)
- March (4)
- February (2)
- January (4)
- 2009
- 2008
- October (1)
- My blog
- Post new blog entry
- All blogs
FGT MGAINSEL and ISHA
2012/03/13
From Ramiro,
---------------------------------------------------------------------------------------------------------------------------------------------------------------
MGAINSEL has been applied to the following channels on assembly 1DA:
RDO=1 ARM=0 GROUP=0 APV=0 VPSP=46 LAT=87 # run 12: 1DA
APV=1 VPSP=46 LAT=87
APV=2 VPSP=46 LAT=87
APV=3 VPSP=46 LAT=87
APV=4 VPSP=46 LAT=87
APV=5 VPSP=46 LAT=87 MGAINSEL=2
APV=6 VPSP=46 LAT=87 MGAINSEL=0
APV=7 VPSP=45 LAT=87 MGAINSEL=1
APV=8 VPSP=42 LAT=87 MGAINSEL=3
APV=9 VPSP=46 LAT=87 MGAINSEL=4
The ISHA parameter is changed in assembly 1BC:
RDO=2 ARM=0 GROUP=0 APV=0 VPSP=45 LAT=87 # run 12: 1BC
APV=1 VPSP=45 LAT=87
APV=2 VPSP=46 LAT=87
APV=3 VPSP=46 LAT=87
APV=4 VPSP=46 LAT=87
APV=5 VPSP=44 LAT=87 ISHA=46
APV=6 VPSP=43 LAT=87 ISHA=45
APV=7 VPSP=45 LAT=87 ISHA=44
APV=8 VPSP=45 LAT=87 ISHA=47
APV=9 VPSP=45 LAT=87 ISHA=48 #< hit with ZDC-W only, beam but no collisions
the first run with this configuration is: 13044029
----------------------------------------------------------------------------------------------------------------------------------------------
The following result comes from analyzing run 13044029, 30, and 31. I've only looked at the 20 APVs belonging to group 1DA and 1BC.
For the following analysis, the ADCMAX cut was placed at 400 counts over pedestal, where the pedestal was defined to be the ADCMIN for each event.
Fig. 1. Chi2 distribution for the 10 APVs
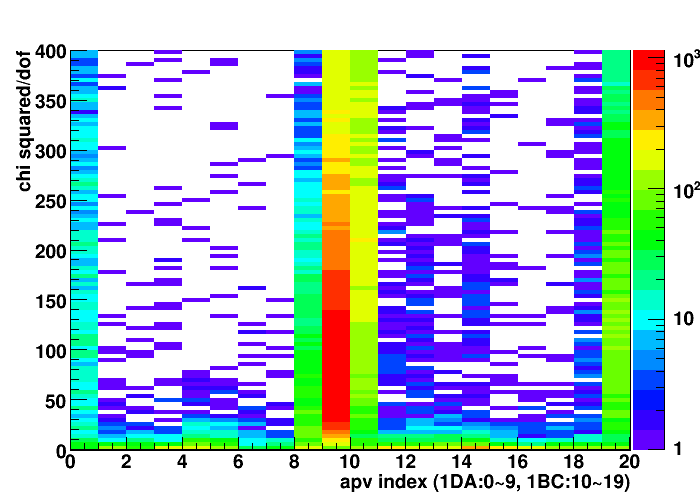
Clearly, there are 5 APVs that don't seem normal, especially the last APV of the 1DA. (rdo=1, arm=0, apv=9)
Fig. 2. Chi2 distribution in 1D for quadrant 1D.

Fig. 3. Example events with chi2>100 from rdo=1 arm=0 apv=9
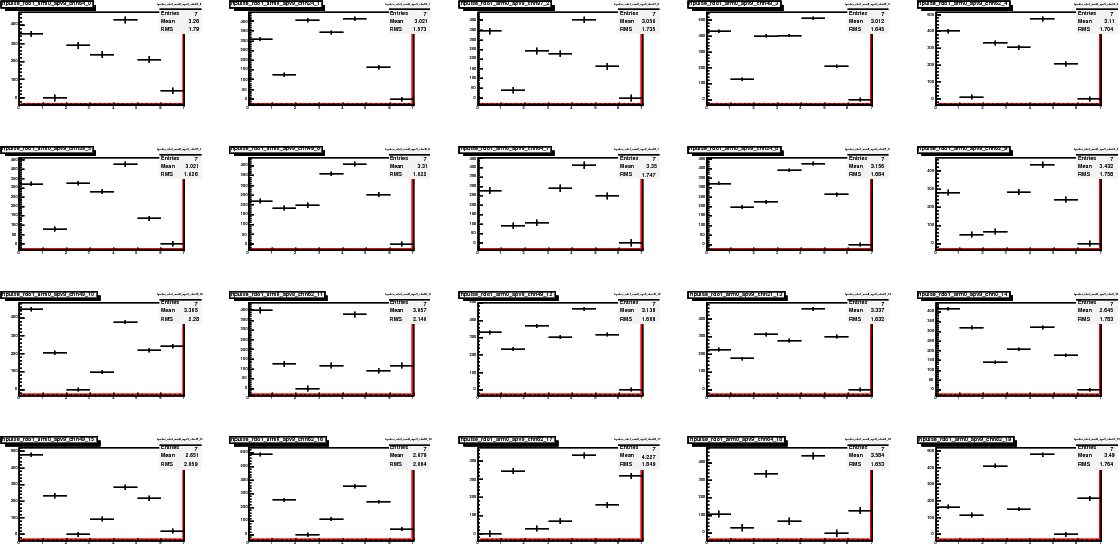
So from here on, we apply the cut chi2<5 to only look at "good events".
Fig. 4. Tau parameter distribution
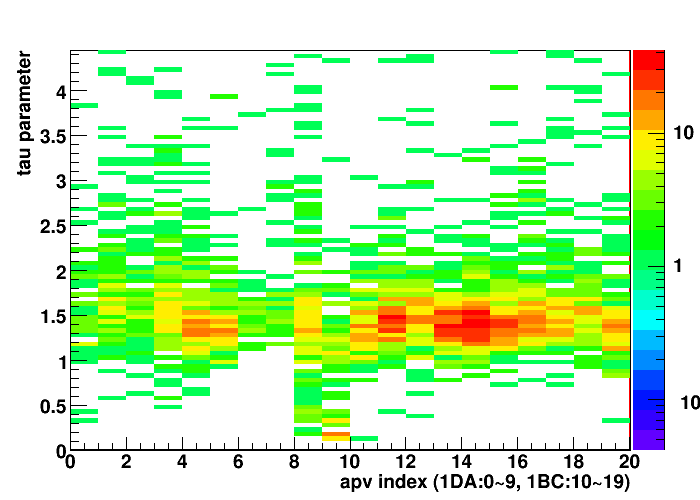
Fig. 5. T0 parameter distribution
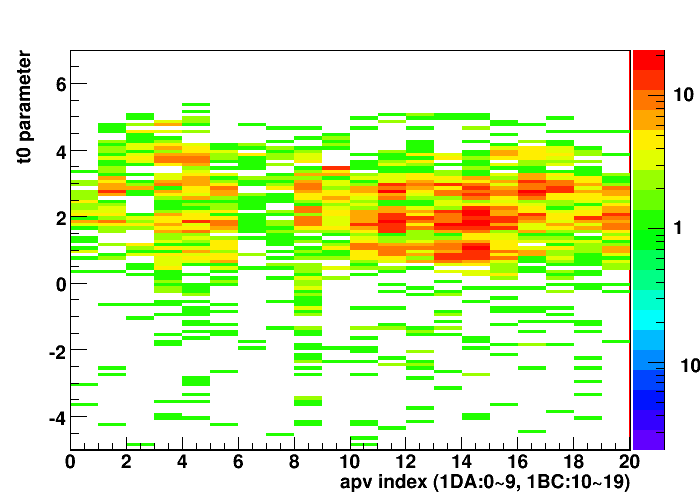
Fig. 6. Normalization constant distribution
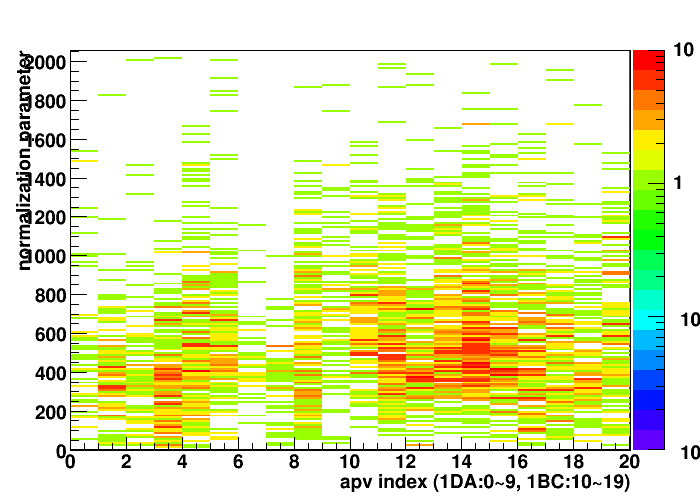
Fig. 7. Tau distribution in 1D for each APV
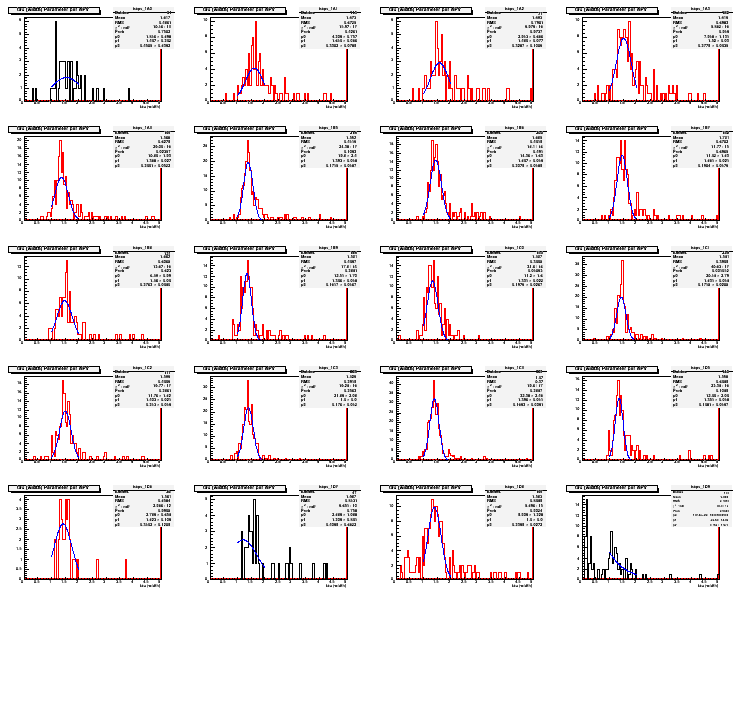
Fig. 8. The gaussian peaks and its error vs APV
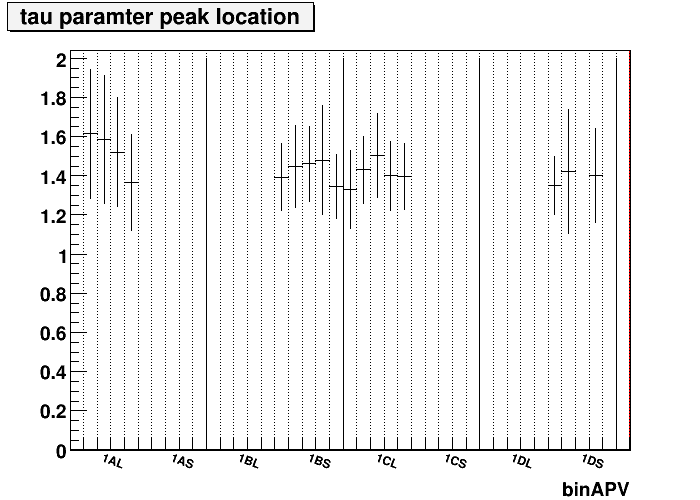
I do not see a clear variation of the pulse shape with these pulses. The actual pulse shapes for each APV can be found in this tar file.
APV by APV plots for the three runs
Quadrant plots for the three runs
- leun's blog
- Login or register to post comments
