- leun's home page
- Posts
- 2013
- 2012
- December (2)
- October (3)
- September (2)
- August (1)
- July (4)
- June (4)
- May (2)
- April (3)
- March (5)
- February (5)
- January (5)
- 2011
- December (3)
- November (3)
- September (5)
- August (2)
- July (2)
- June (3)
- May (4)
- April (4)
- March (2)
- February (4)
- January (2)
- 2010
- December (2)
- November (3)
- October (3)
- September (5)
- August (6)
- July (2)
- June (4)
- May (3)
- April (4)
- March (4)
- February (2)
- January (4)
- 2009
- 2008
- October (1)
- My blog
- Post new blog entry
- All blogs
FGT time shape analysis update 2
Time Shape Anlaysis Update 2
APV Index = APV + 24* ARM
In this test, I see ARM 0, 2, and 4. For each, I see 10 APVs, starting from 0 to 9. So APV 0~10 are, index 0~9, 48~57, and 96~105 for ARM 0, 2, and 4.
I still have not implemented proper pedestals. As before, I simply subtract the lowest ADC count of any given event from all time bins. The estimated pedestal width is added as part of the error estimates.
Last time, I've identified the following pathological shape, that looks like the ADC is saturated.
Fig. 1. "Saturated" distributions

I have looked at the APV and channels that produce these shapes, and so far it doesn't seem like this is a localized phenomena. Also, addcing back the ADCMIN I subtracted out, most of these still do not come close to 4000 ADC counts. So I do not know why this happens.
While less common, I've also identified the following shape, that is characterized by a maximum and a minimum "oscillating" around a center line.
Fig. 2. "Oscillation" shape

Luckily, this is basically localized to one or two APVs (arm 2 apv 0/1).
Fig. 3. APVs that produce "oscillating" time shape.
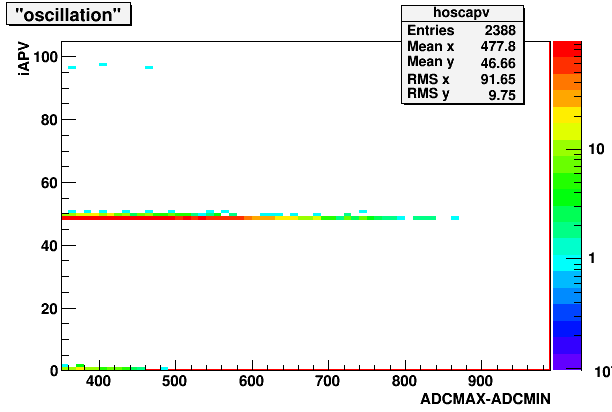
For the iAPV=48 (ARM2, APV0) most of the events are indeed "oscilations".
Fig. 3a. ADCMAX spectrum for iAPV=48, black: total, red: oscillation
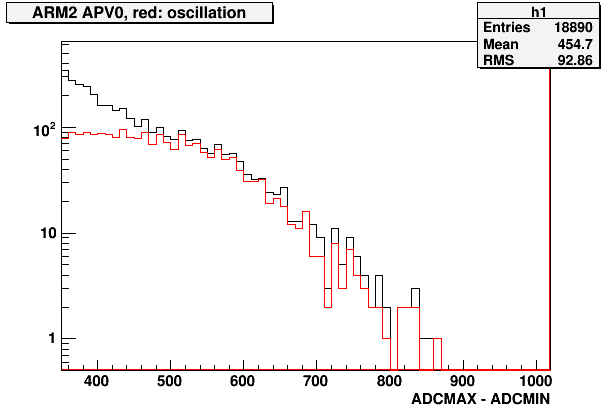
The "oscillation" being suppressed at low ADC count is likely due to my "oscillation" filter algo than the actual quality of the signal. Looking at this apv event by event, most of the events even at low ADC are oscillatory.
Fig. 3b. Minimum vs. maximum time bin distribution for iAPV=48, for ADCMAX-ADCMIN > 350 (The pattern shown in Fig. 2 corresponds to the highest bin with 3993 counts)
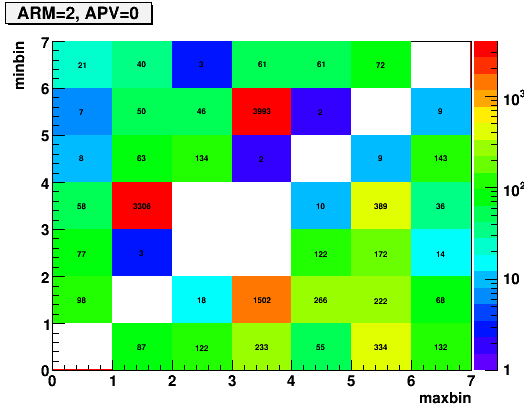
The take away here is that most of the events in iAPV=48 are of "oscillation" type, and they seem to have fixed nodes in time bins. That is, you get a maximum(minimum) at the central time bin, at bin=3, and then you get a minimum(maximum) two bins before or after, at bin=1 or 5.
But within these APVs, I don't see localization for channels.
Fig. 4. Channels that produce "oscillating" time shape.
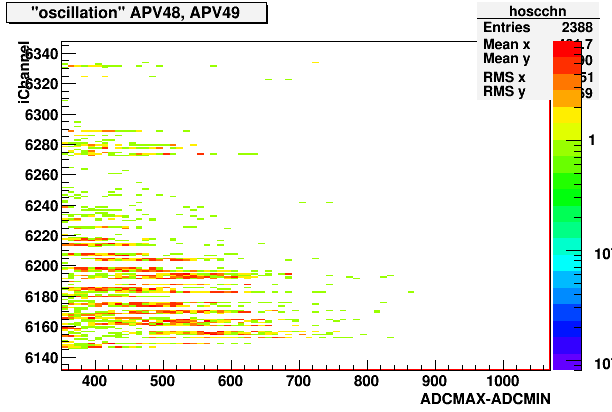
So from this point on, I simply dropped these two APVs from analysis.
As Gerard suggested, I've used the followng function to fit the time shape.
f(t) = A * (t-t0)**p * exp( -(t-t0) / tau ) + C for t > t0
f(t) = 0 for t < t0
A: Normalization
p: Exponent, fixed at 2 for now.
t0: t-offset
tau: Width parameter, possibly constant for each APV.
C: ADC offset, fixed at 0 for now, as the estimated width of the pedestal is included in the bin errors.
NOTE: I've also tried the Landau distribution, as it naturally goes to zero at t=t0, and the fitting is faster. It works well enough, but the tail doesn't fall quite as fast as the above function, and it shows odd correlation between the width and the offset presumably due to this mismatching tail shape. So I gave up on it.
Fig. 5. The first 40 examples of "good" fits. (chi^2 < 20, 4 dof, ADCMAX - ADCMIN > 350)
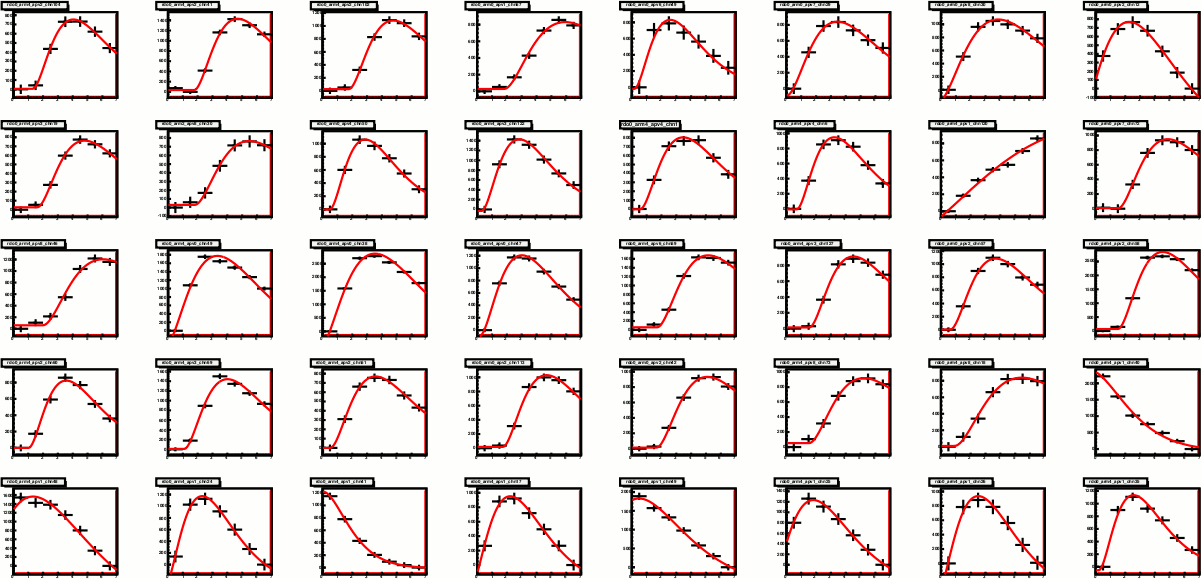
Fig. 6. Chi^2 distribution
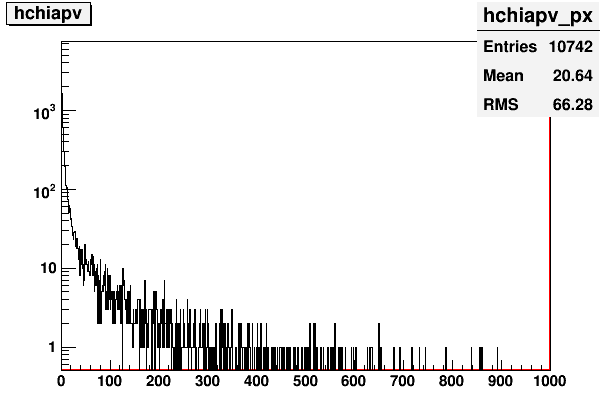
Fig. 7. Average chi^2 by APV (profile plot)
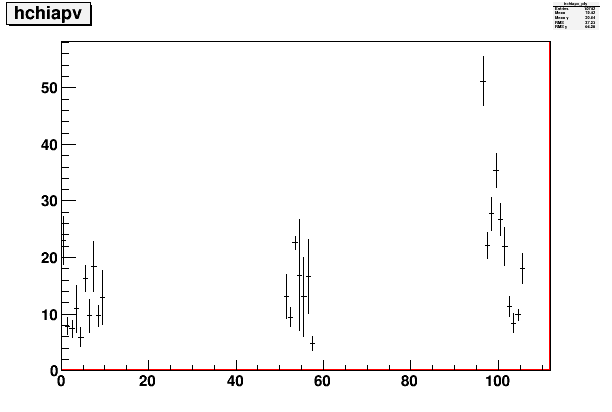
Overall, APVs in ARM4 tend to do worse than the others. They also have more signals in them. Looking at the event by event plots, I have not identified anything particularly pathological about these APVs yet.
Fig. 8. APV index vs. the t-value at which the fit funtion is the maximum. (signal peak)
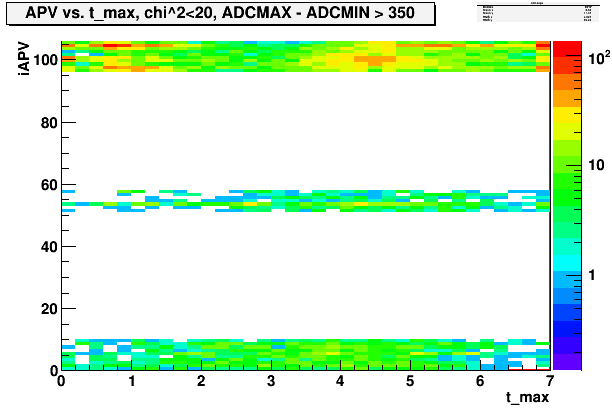
For ARM0 and ARM2, the peak occurs most between time bin 4 and 5, but with a fairly wide spread. The ARM4 shows wider spread, with 2 concentrated regions around bin 0 and bin 5.
Fig. 9. APV index vs. t0-parameter distribution
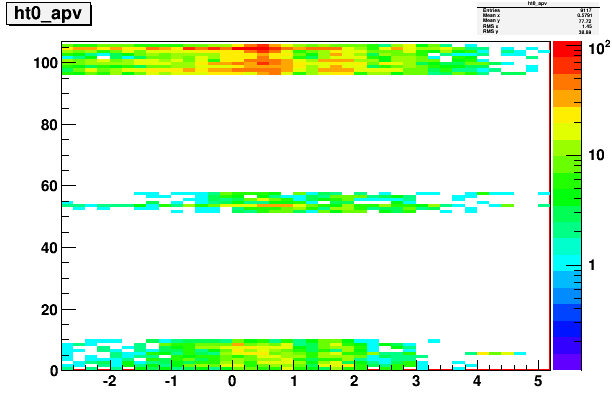
Similar story to the t-max, as it should be.
Fig. 10. APV index vs. tau-parameter distribution
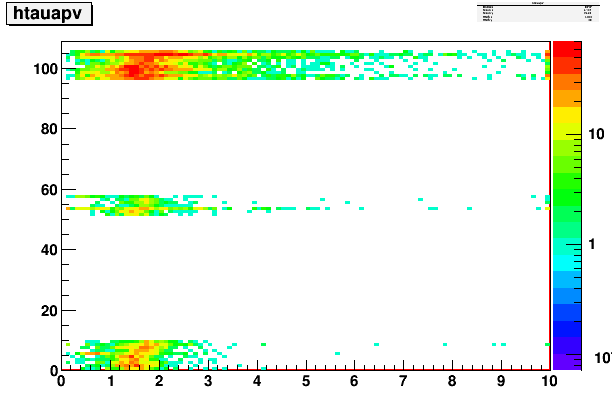
This is the one that may hopefully be well defined for each APV. And for the most part, it is. The following plot shows 1D distribution of the tau parameter for each APV.
Fig. 11. tau-parameter distribution for each APV. 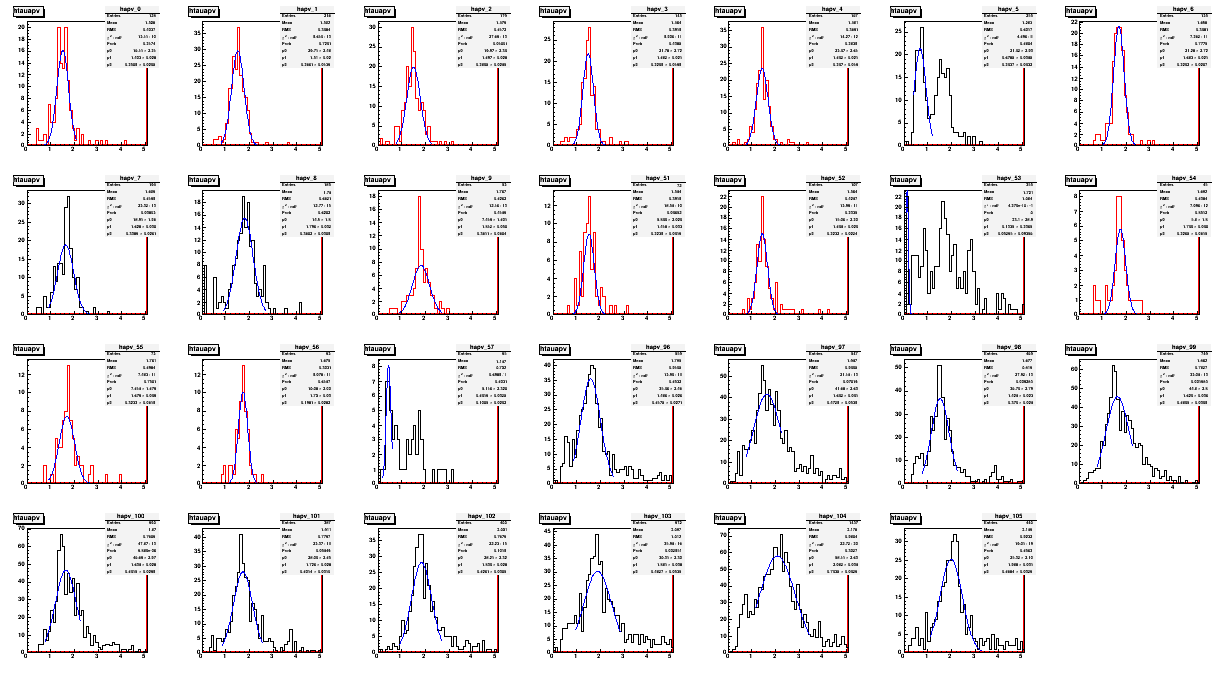
I've tried a simple gaussian fit, and based on the fit result and the RMS of the distribution, I've selected the APVs that have "narrow enough" distributions of the tau-parameter. Those are the red distributions. The black ones were deemed not good enough, like the cases where we have multiple peaks.
For only those APVs that have "good" tau-parameter distributions, I've re-did the fit by fixing the tau-parameter at the gaussian centroid value. As there is a significant spread even for the selected APVs, some level of degradation is expected.
Fig. 12. the first 40 "good fits" with fixed tau-parameter.

Here already, we see more deviations at the tail. The chi^2 distribution looks like the following. (red)
Fig. 13. Chi^2 distribution for BLACK: free tau-parameter (dof=4), and RED: fixed (dof=5).
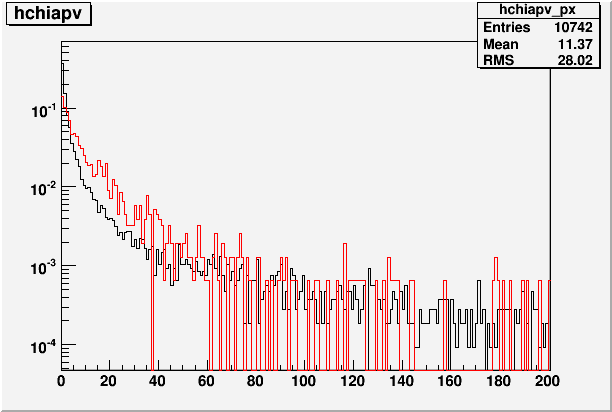
- leun's blog
- Login or register to post comments
