- leun's home page
- Posts
- 2013
- 2012
- December (2)
- October (3)
- September (2)
- August (1)
- July (4)
- June (4)
- May (2)
- April (3)
- March (5)
- February (5)
- January (5)
- 2011
- December (3)
- November (3)
- September (5)
- August (2)
- July (2)
- June (3)
- May (4)
- April (4)
- March (2)
- February (4)
- January (2)
- 2010
- December (2)
- November (3)
- October (3)
- September (5)
- August (6)
- July (2)
- June (4)
- May (3)
- April (4)
- March (4)
- February (2)
- January (4)
- 2009
- 2008
- October (1)
- My blog
- Post new blog entry
- All blogs
Some oddities from the test run
Here I collected some of the things that I didn't really understand from the 100 event test run that Gerard posted.
/afs/rhic.bnl.gov/star/users/gvisser/GV_test2_r75_5tb_2.sfs
Jan pointed out that the "good fit" plots that I posted from analyzing this file looked suspiciously non-random. So I looked at the plots more closely, and realized that a particular APV tends to have a particular shape of the distribution. Case in point, if you look at the aforementioned pdf file, on the first page, the second row is arm3 apv9 from the very first event, and while they all come from different channels, the shape basically looks identical.
As I haven't caught up with the status bits and such, I realize that I am likely looking at something that has a known issue. If that's the case, no harm done.
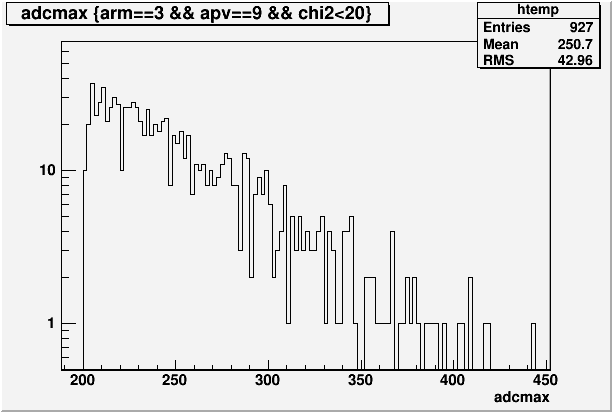
So I looked at this particular apv, rdo1 arm3 apv9, for events with adcmax>200+adcmin a little more. 200 counts is not much, but then again it should be well above what one would expect from pedestal fluctuation. The ADCMIN for this apv is only around 250 counts for most events.
NOTE: Gerard, I am still hunting for the lowest adc to use as my fake pedestal. I'll change this in the future.
Fig. 1. adcmax-adcmin distribution

Nothing strange here, or at least I don't know how fast it should fall.
Fig. 2. Chi2 distribution for this apv
.gif)
As I have been fiddling with my error function, the absolute value of the mean doesn't matter too much, and again, I'm not sure if anything is wrong.
Fig. 3. Time bin that has the maximum ADC value (counting from 1, sorry) Again, adcmax has to be at least 200 counts more than adcmin
.gif)
On the other hand, this looks strange. I would think that noise shouldn't favor timebin #2 (#3 from above plot, again I counted from 1)
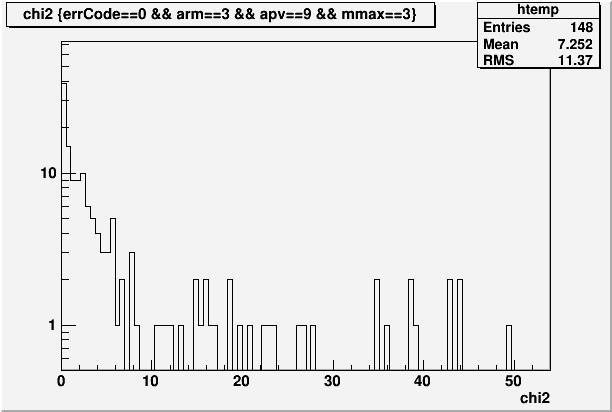
Fig. 4. chi2 distribution for this apv, when the max time bin == 2 (The peak in fig 3)

So the chi2 is strikingly better than what it is without this max time bin condition.
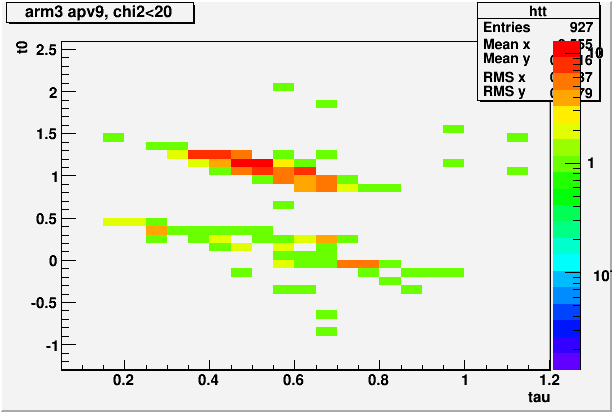
Fig. 5. Tau vs. t0 distribution for this apv, total chi2<20

Here again, there is an evidence that a pattern exists in this apv. Strange.
So at this point, I just ran throught that file again, and this time printed out all the events with adcmax>200+adcmin and chi2<20 for this particular apv, rdo1 arm3 apv9. The result is found here. The number at the end of the histgoram name is the event number, and you'll notice that the last plot is from the 70th of the 100 events.
I'm not sure what's going on with this apv, but it does have a tendency to have a pattern that sort of looks like a signal. It isn't just that 1 time bin is high, but it tends to have the neighboring bins also high, making it look pretty realistic. Granted the amplitude is very small (2~300 counts above ped) compared to what my understanding of the actual signal will be, but still, it's a bit odd.
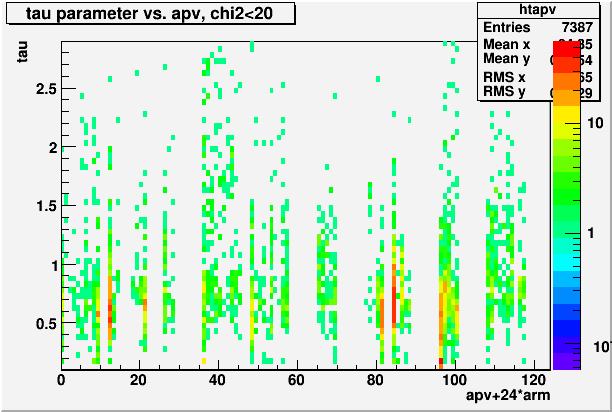
Fig. 6. Finally, a plot of tau vs. apv, where I am NOT using the apv indexing I'm supposed to use. I promise this is the last plot before I switch over.

Since there is no signal, there shouldn't be a sharp pattern. But on the other hand, since the total number of bin is finite, the width of the fit function will tend to be loosely bounded.
- leun's blog
- Login or register to post comments
