- leun's home page
- Posts
- 2013
- 2012
- December (2)
- October (3)
- September (2)
- August (1)
- July (4)
- June (4)
- May (2)
- April (3)
- March (5)
- February (5)
- January (5)
- 2011
- December (3)
- November (3)
- September (5)
- August (2)
- July (2)
- June (3)
- May (4)
- April (4)
- March (2)
- February (4)
- January (2)
- 2010
- December (2)
- November (3)
- October (3)
- September (5)
- August (6)
- July (2)
- June (4)
- May (3)
- April (4)
- March (4)
- February (2)
- January (4)
- 2009
- 2008
- October (1)
- My blog
- Post new blog entry
- All blogs
FMS-FTPC from Jim D.
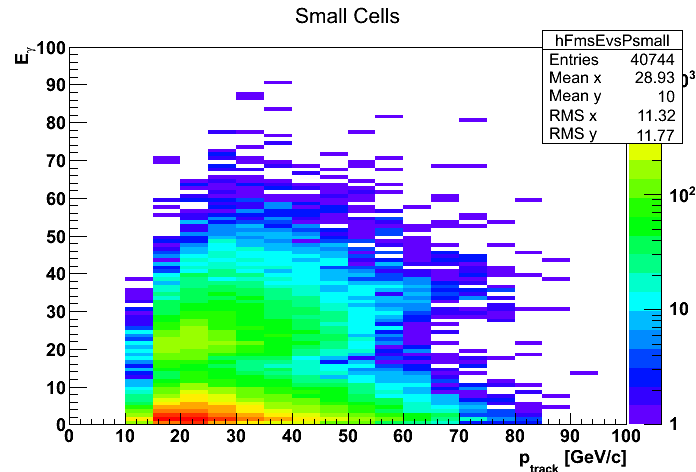
FMS small cell and FTPC corellation from Jim D.'s analysis
Jim's auto correlation page (Fig. 5)
Fig. 1. Fms-small cluster energy vs. FTPC track momentum

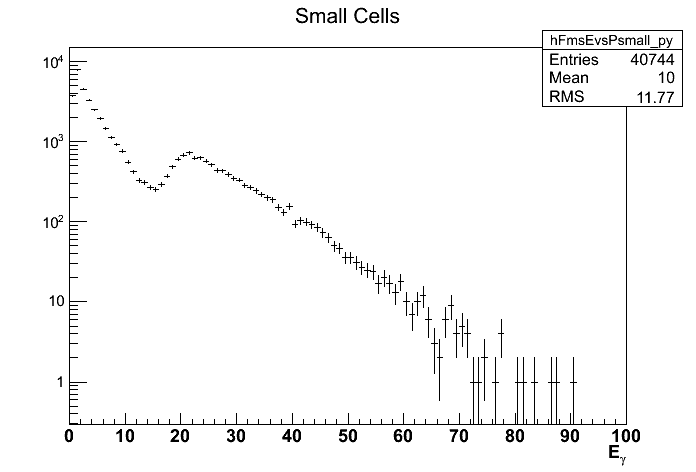
Fig. 2. Y-projection of fig. 1. (FMS energy)

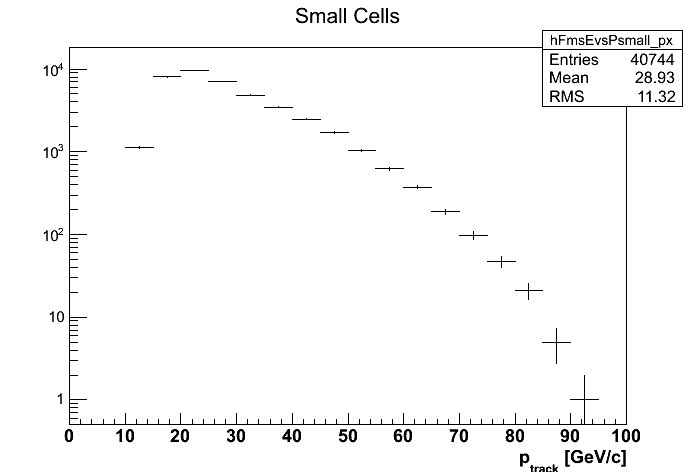
Fig 3. X-projection of fig. 1. (FTPC track momentum)

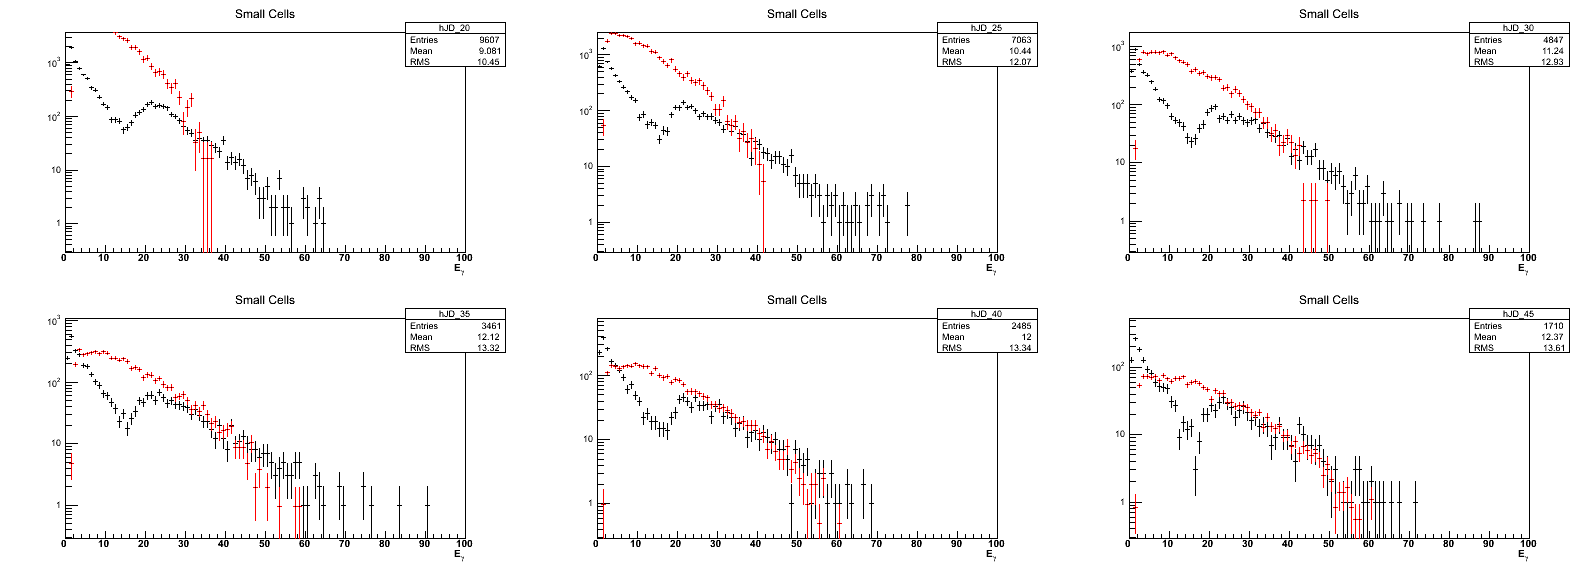
Fig. 4. Black: FMS cluster energy from fig. 1. Red: Pi+ only FPD East GSTAR simulation

Groups:
- leun's blog
- Login or register to post comments
