- leun's home page
- Posts
- 2013
- 2012
- December (2)
- October (3)
- September (2)
- August (1)
- July (4)
- June (4)
- May (2)
- April (3)
- March (5)
- February (5)
- January (5)
- 2011
- December (3)
- November (3)
- September (5)
- August (2)
- July (2)
- June (3)
- May (4)
- April (4)
- March (2)
- February (4)
- January (2)
- 2010
- December (2)
- November (3)
- October (3)
- September (5)
- August (6)
- July (2)
- June (4)
- May (3)
- April (4)
- March (4)
- February (2)
- January (4)
- 2009
- 2008
- October (1)
- My blog
- Post new blog entry
- All blogs
FCS hadron resolution
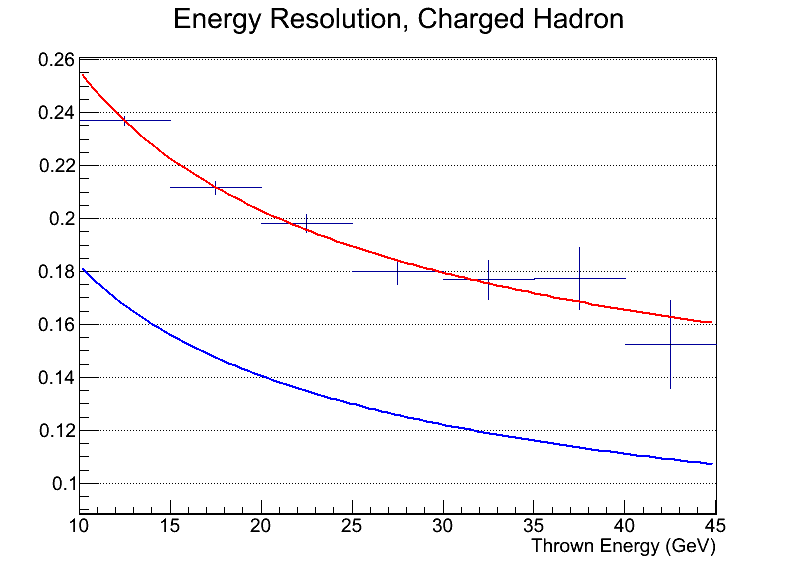
The attached presentaion was shown on 7/23/13. Despite improvements in EMCal-HCal cross-calibration procedure, it was found that my full simulation still showed significantly worse hadronic resolution than what Yuxi estimated based on single particle only simulation and without reconstruction.
Fig. 1. Hadronic resolution plot from last week's presentation, blue line is Yuxi's best case.

The culprit was thought to be the combination of reconstruction and background, the latter coming in likely during the HCal-EMCal cluster association.
Since Monday, I have made two changes to my simulation.
1. For the HCal clusters, I now use cluster summed energy. Previously, I was using fitted energy, which could add additional smearing.
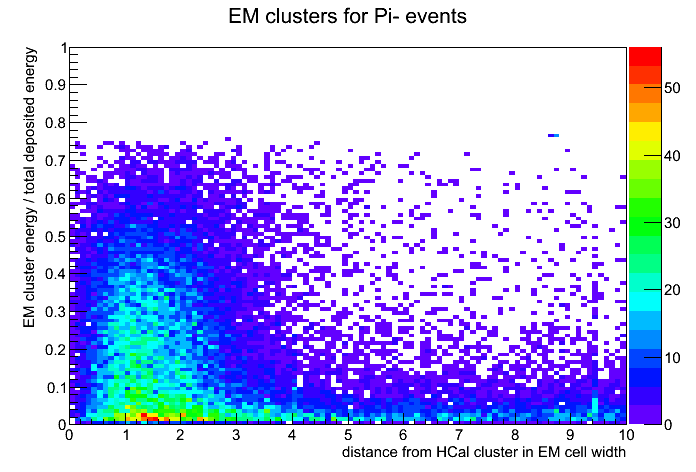
2. I reduced the radius in which I associate EMCal clusters with an HCal cluster, from 6 EM cell width to 4.
The change #2 is based on the following plot, obtained from Pi- only simulation.
Fig. 2. Pi- only simulation, distance between HCal cluster and associated EMCal clusters

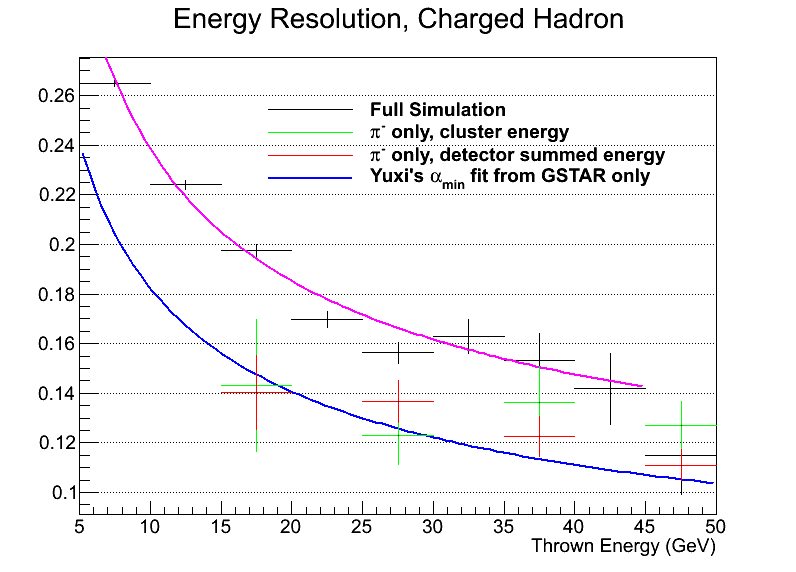
These changes, especially the use of cluster energy, does improve the resolution somewhat. It is, however, still worse than the single particle case.
The following plot shows the result for the full simulation, and also the result from Pi- only simulation outputs I got from Yuxi, processed using the same reconstruction I use for the full simulation.
Fig. 3. Current status of hadronic energy resolution

The "a" and "b" values, still added linearly, improves from last week as following.
a: 0.66 -> 0.58
b: 0.06 -> 0.057
For the Pi- only simulation, I computed the resolution both by using cluster energy (the same as the full simulation), and also by using the detector summed energy (no reconstruction, but obviously impossible for the full simulation). The results for the two are within the error bars, suggesting that the remaining discrepany is likely not dominated by the reconstruction.
Finally, I have looked at the eta dependence of the resolution, and I do not see an obvious pattern. The mean of the distribution changes somewhat, suggesting that calculating resolution for narrow slices of eta would in principle improve the resolution, but the effect was not big enough when I tried it to compensate for the loss of statistics.
- leun's blog
- Login or register to post comments
