FCS ECal invariant mass plot tower by tower
Datasets: OO 200 GeV (run 21) , 10 runs in day 131 & 132 (about 10.8M total) with both Ecal and Hcal closed
Trigger: mb-hlt-30, mb-hlt-200
Initial gain for all towers: 0.0013 GeV/ch
Event selection: TOF mult < 20 ; Ecal hit mult < 40 ; Each cluster energy > 1 GeV ; Each pair energy asymmetry Z < 0.7 ; Keep only one best pair (energy max pair) for each event.
Here are the invariant mass plot tower by tower. North side Ecal 748 towers (mass_by_tower_Ncluster.jpg) , south side Ecal 748 towers (file: mass_by_tower_Scluster.jpg).
Applying Gaussian fit for signal and power*exponential function for background fit to fit for the invariant mass plots.
Example plot for fit:
.png)
•Status 5: good invariant mass peak : distance between invariant mass peak from fit and π^0 peak less than 0.0135 GeV, 10% difference
•Status 4: distance between invariant mass peak from fit and π^0 peak 0.0135 GeV to 0.045 GeV. (not too far away, really need gain correction)
•Status 3: maximum entry bin sits at background tail. If it has good invariant mass peak fitting around π^0 invariant mass, we still consider to calculate the gain correction.
•Status 2:bad invariant mass peak fitting using Gaussian function for peak
• Status 1: entries < 500. Status 0 (white): no entry. No gain correction for status 2, 1 and 0.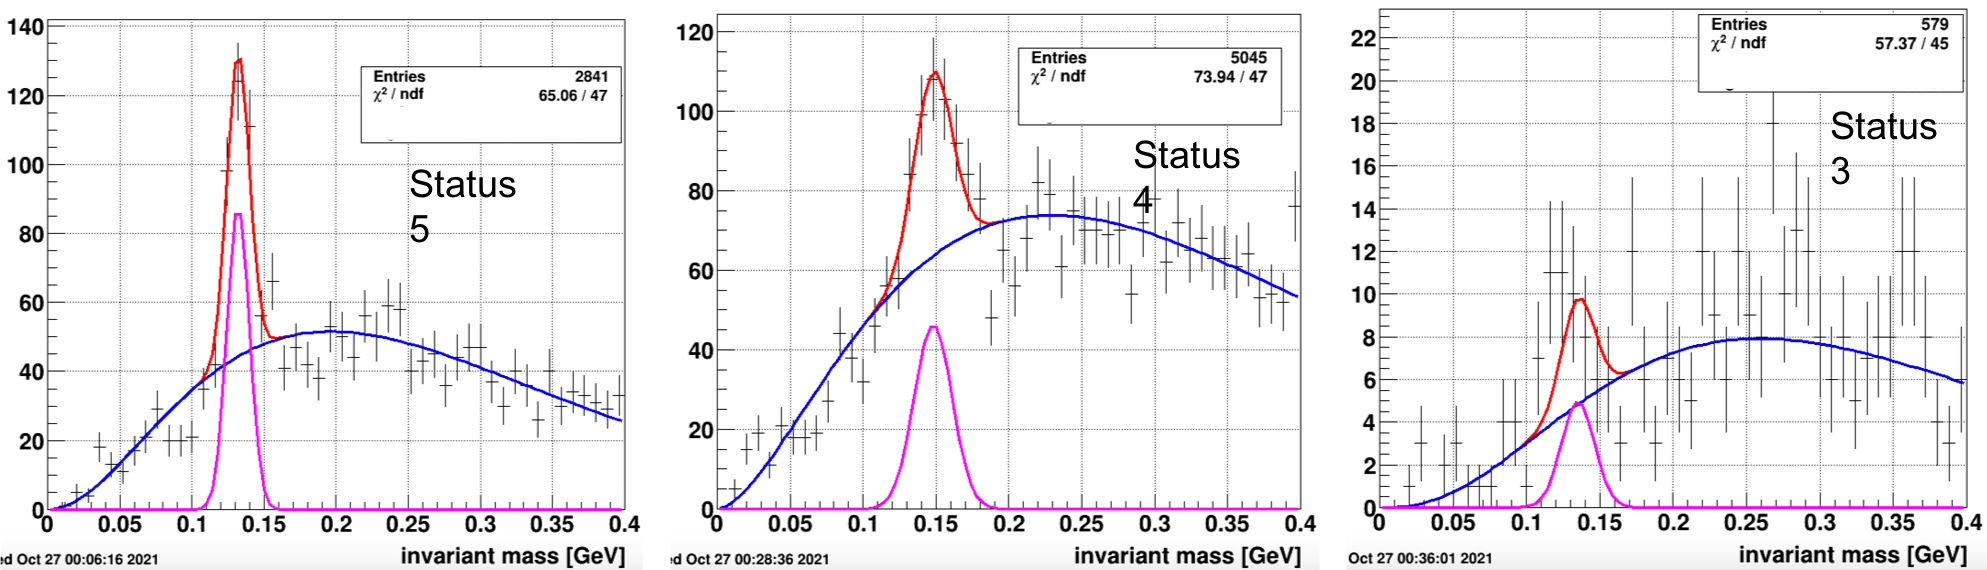
Then calculate gain correction factor = old gain correction (original is 1) * 0.135 (pi0 mass) / Gaussian fit mean. Use the new gain correction factor for each tower and run again for the data sets. Status 2, 1, 0 will not change gain correction factor.
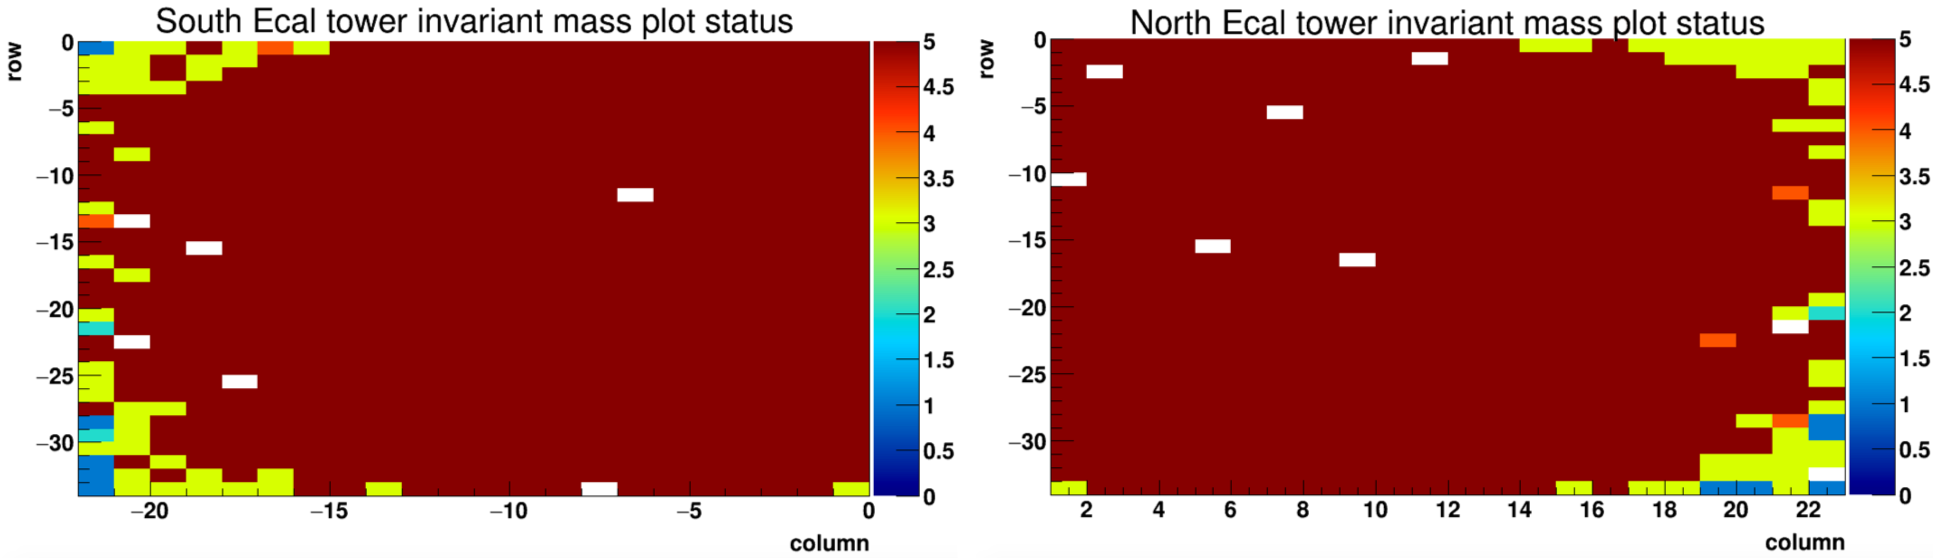
Tower status plot after 2 iteration.
Attach plots shows all tower invariant mass plots with fit after 2 iteration for gain correction. 748 North tower plots fit: (mass_by_tower_Ncluster_2iteration.jpg) ; 748 South tower plots fit: (mass_by_tower_Scluster_2iteration.jpg) in the attachment
Note: it's difficult to display 748 plots at the same time, so the resolution of each plot is poor but they can roughly give you a sense on the distribution.
Finally, the gain correction distribution for all status 5 towers:
Gain for all towers should be 0.0013 * 0.93 = 0.0012 GeV/ch , with +-13% spread
.png)
- liangxl's blog
- Login or register to post comments