Semi-successful EPD timing scan for 2023 RHIC run
Updated on Thu, 2023-05-18 17:19. Originally created by lisa on 2023-05-18 16:26.
This page describes the EPD timing scan for the 2023 RHIC run, done in very early hours 18 May 2023. It is deemed "semi-successful" because the new fourth crate (EQ4) in the system would not configure, and all of the QT32Ds saw MIPs for no gate values-- i.e. they are likely in the wrong bunch crossing, though we could not have known that without first doing the scan.
This year, the EPD electronics changed in two ways. The first is the rearrangement of QT32s into four crates, instead of 3. The second is the introduction of yet another flavor of QT32: QT32D now joins the QT32B and QT32C groups.
For the record, here are the layouts of the four crates. Slots 0-6 host East-side QTs and 8-14 host West-side QTs.
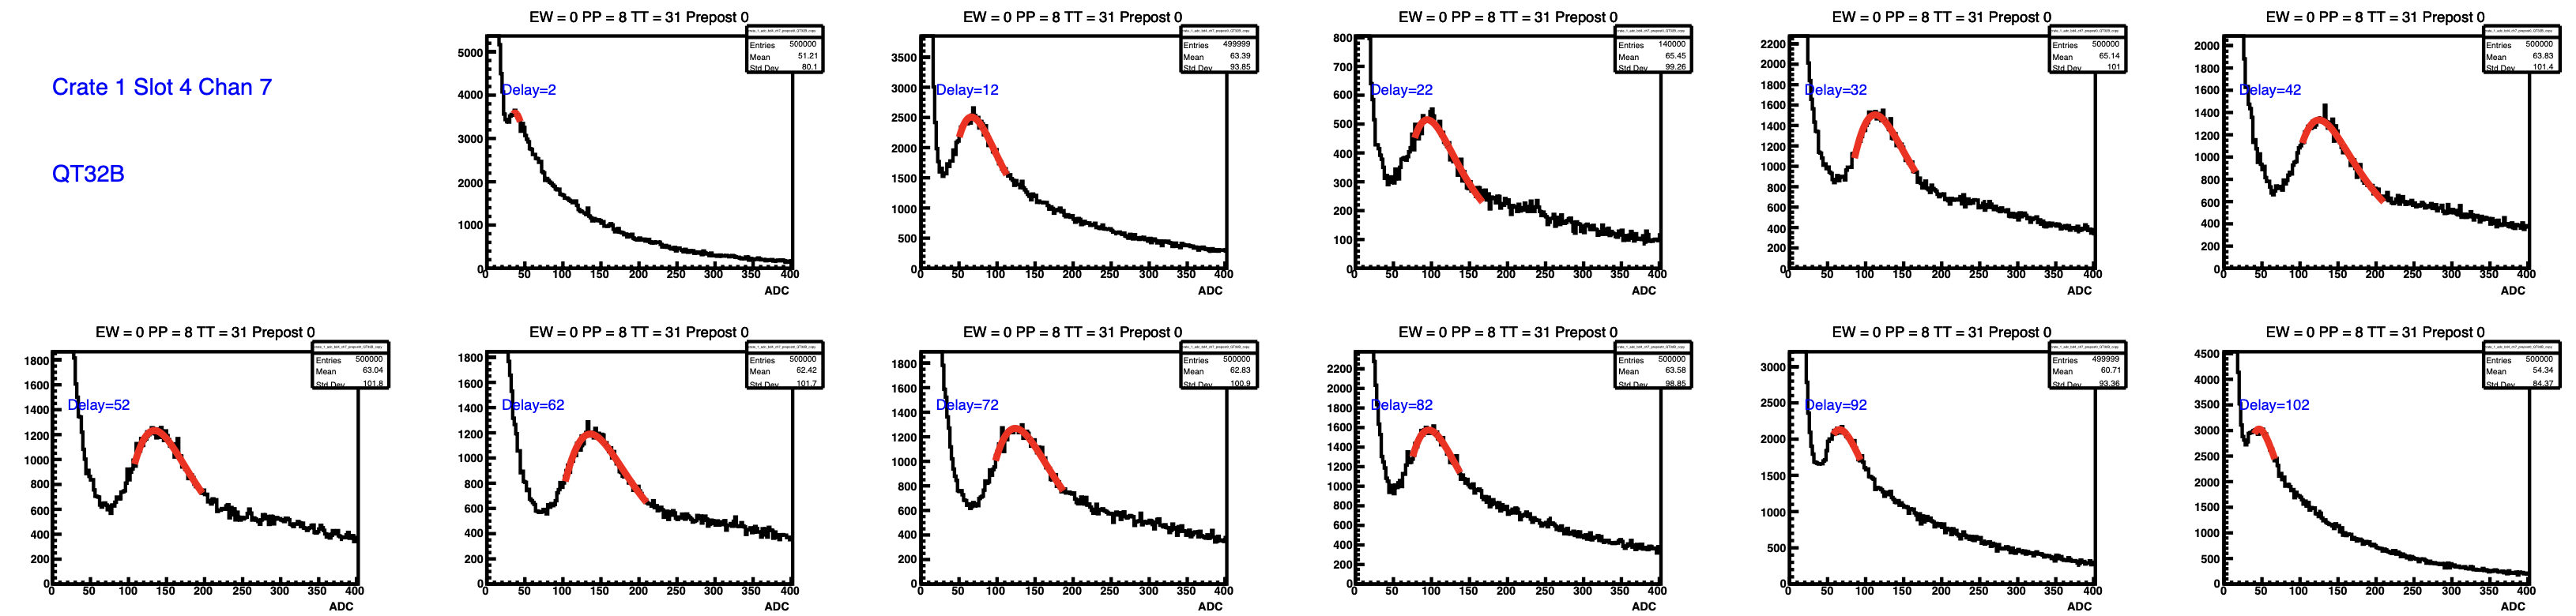
All QTBs in EQ1-3 showed nice MIP peaks. Here is a representative case. Each panel corresponds to one run (i.e. one value of the Start_Delay):
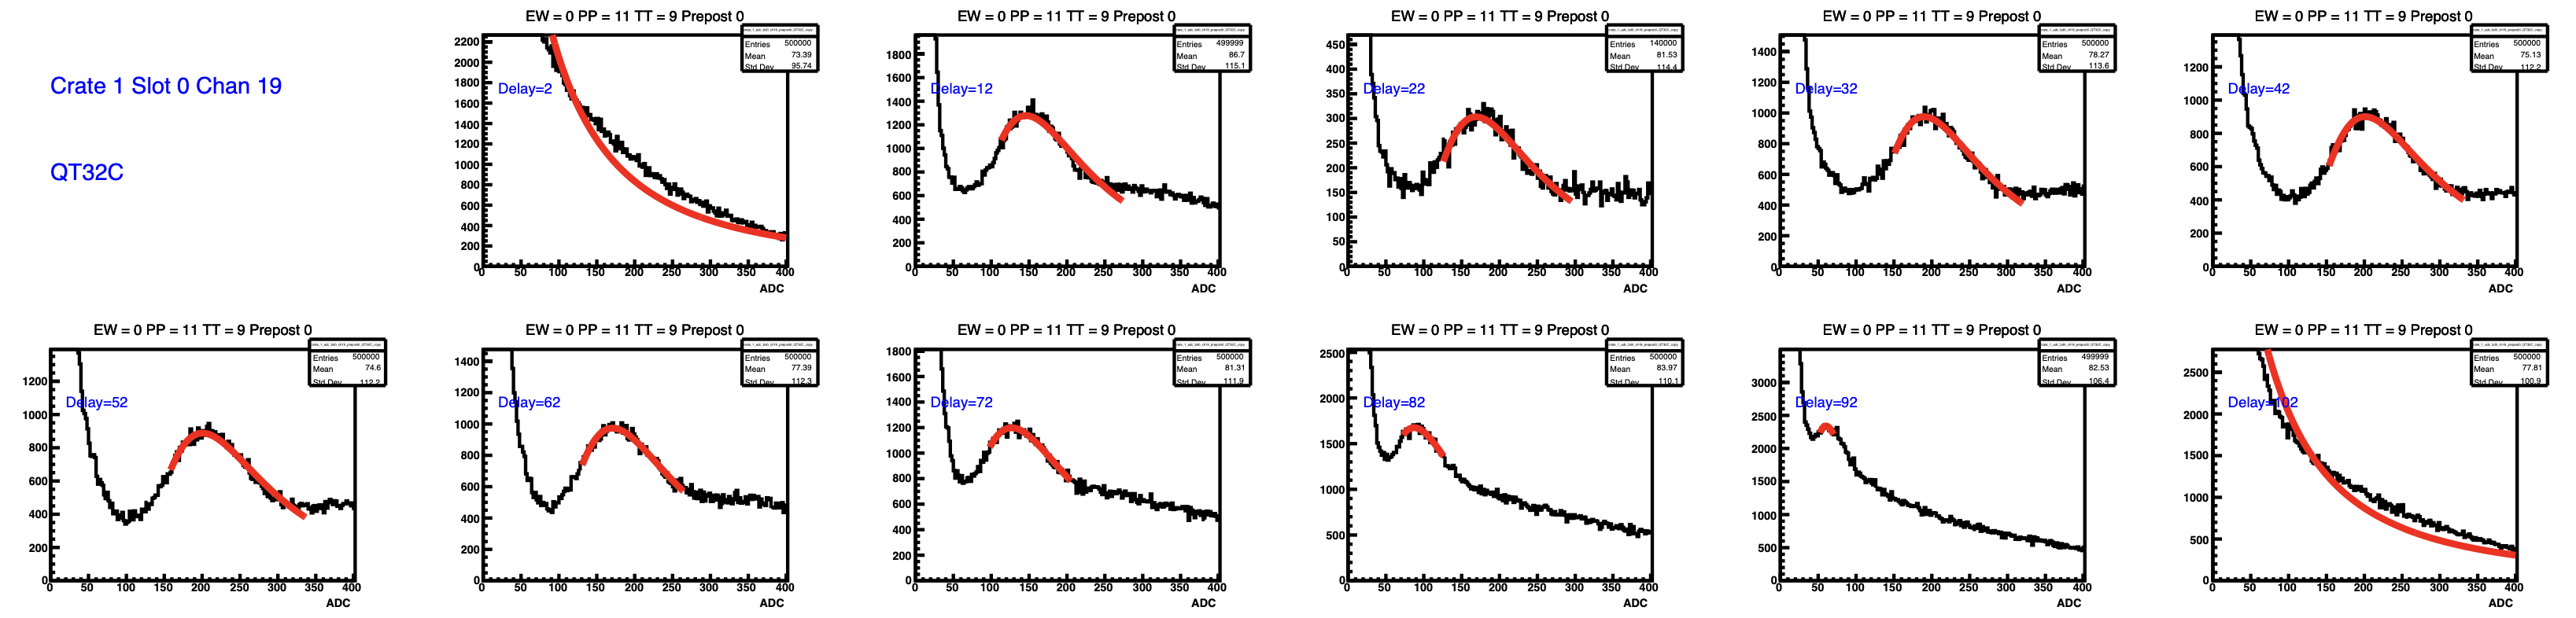
Similarly, all QTCs in EQ1-3 showed nice MIP peaks. Here is a representative example:
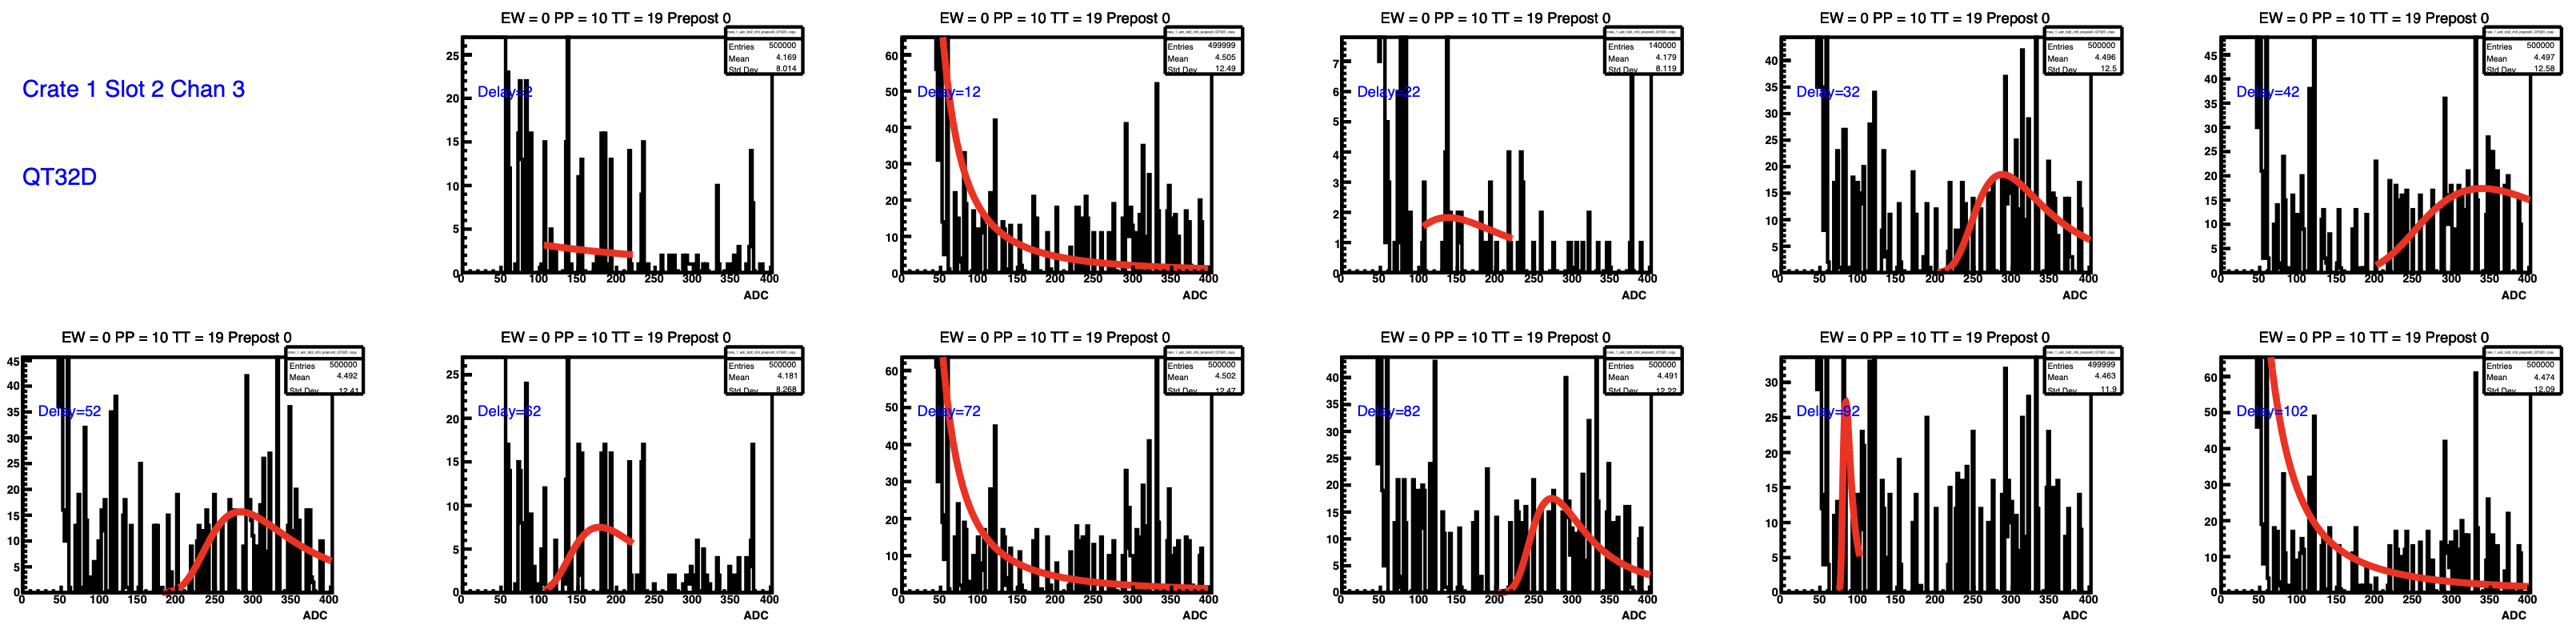
None of the QTDs showed a MIP peak, for any value of gate delay. Here's an example:
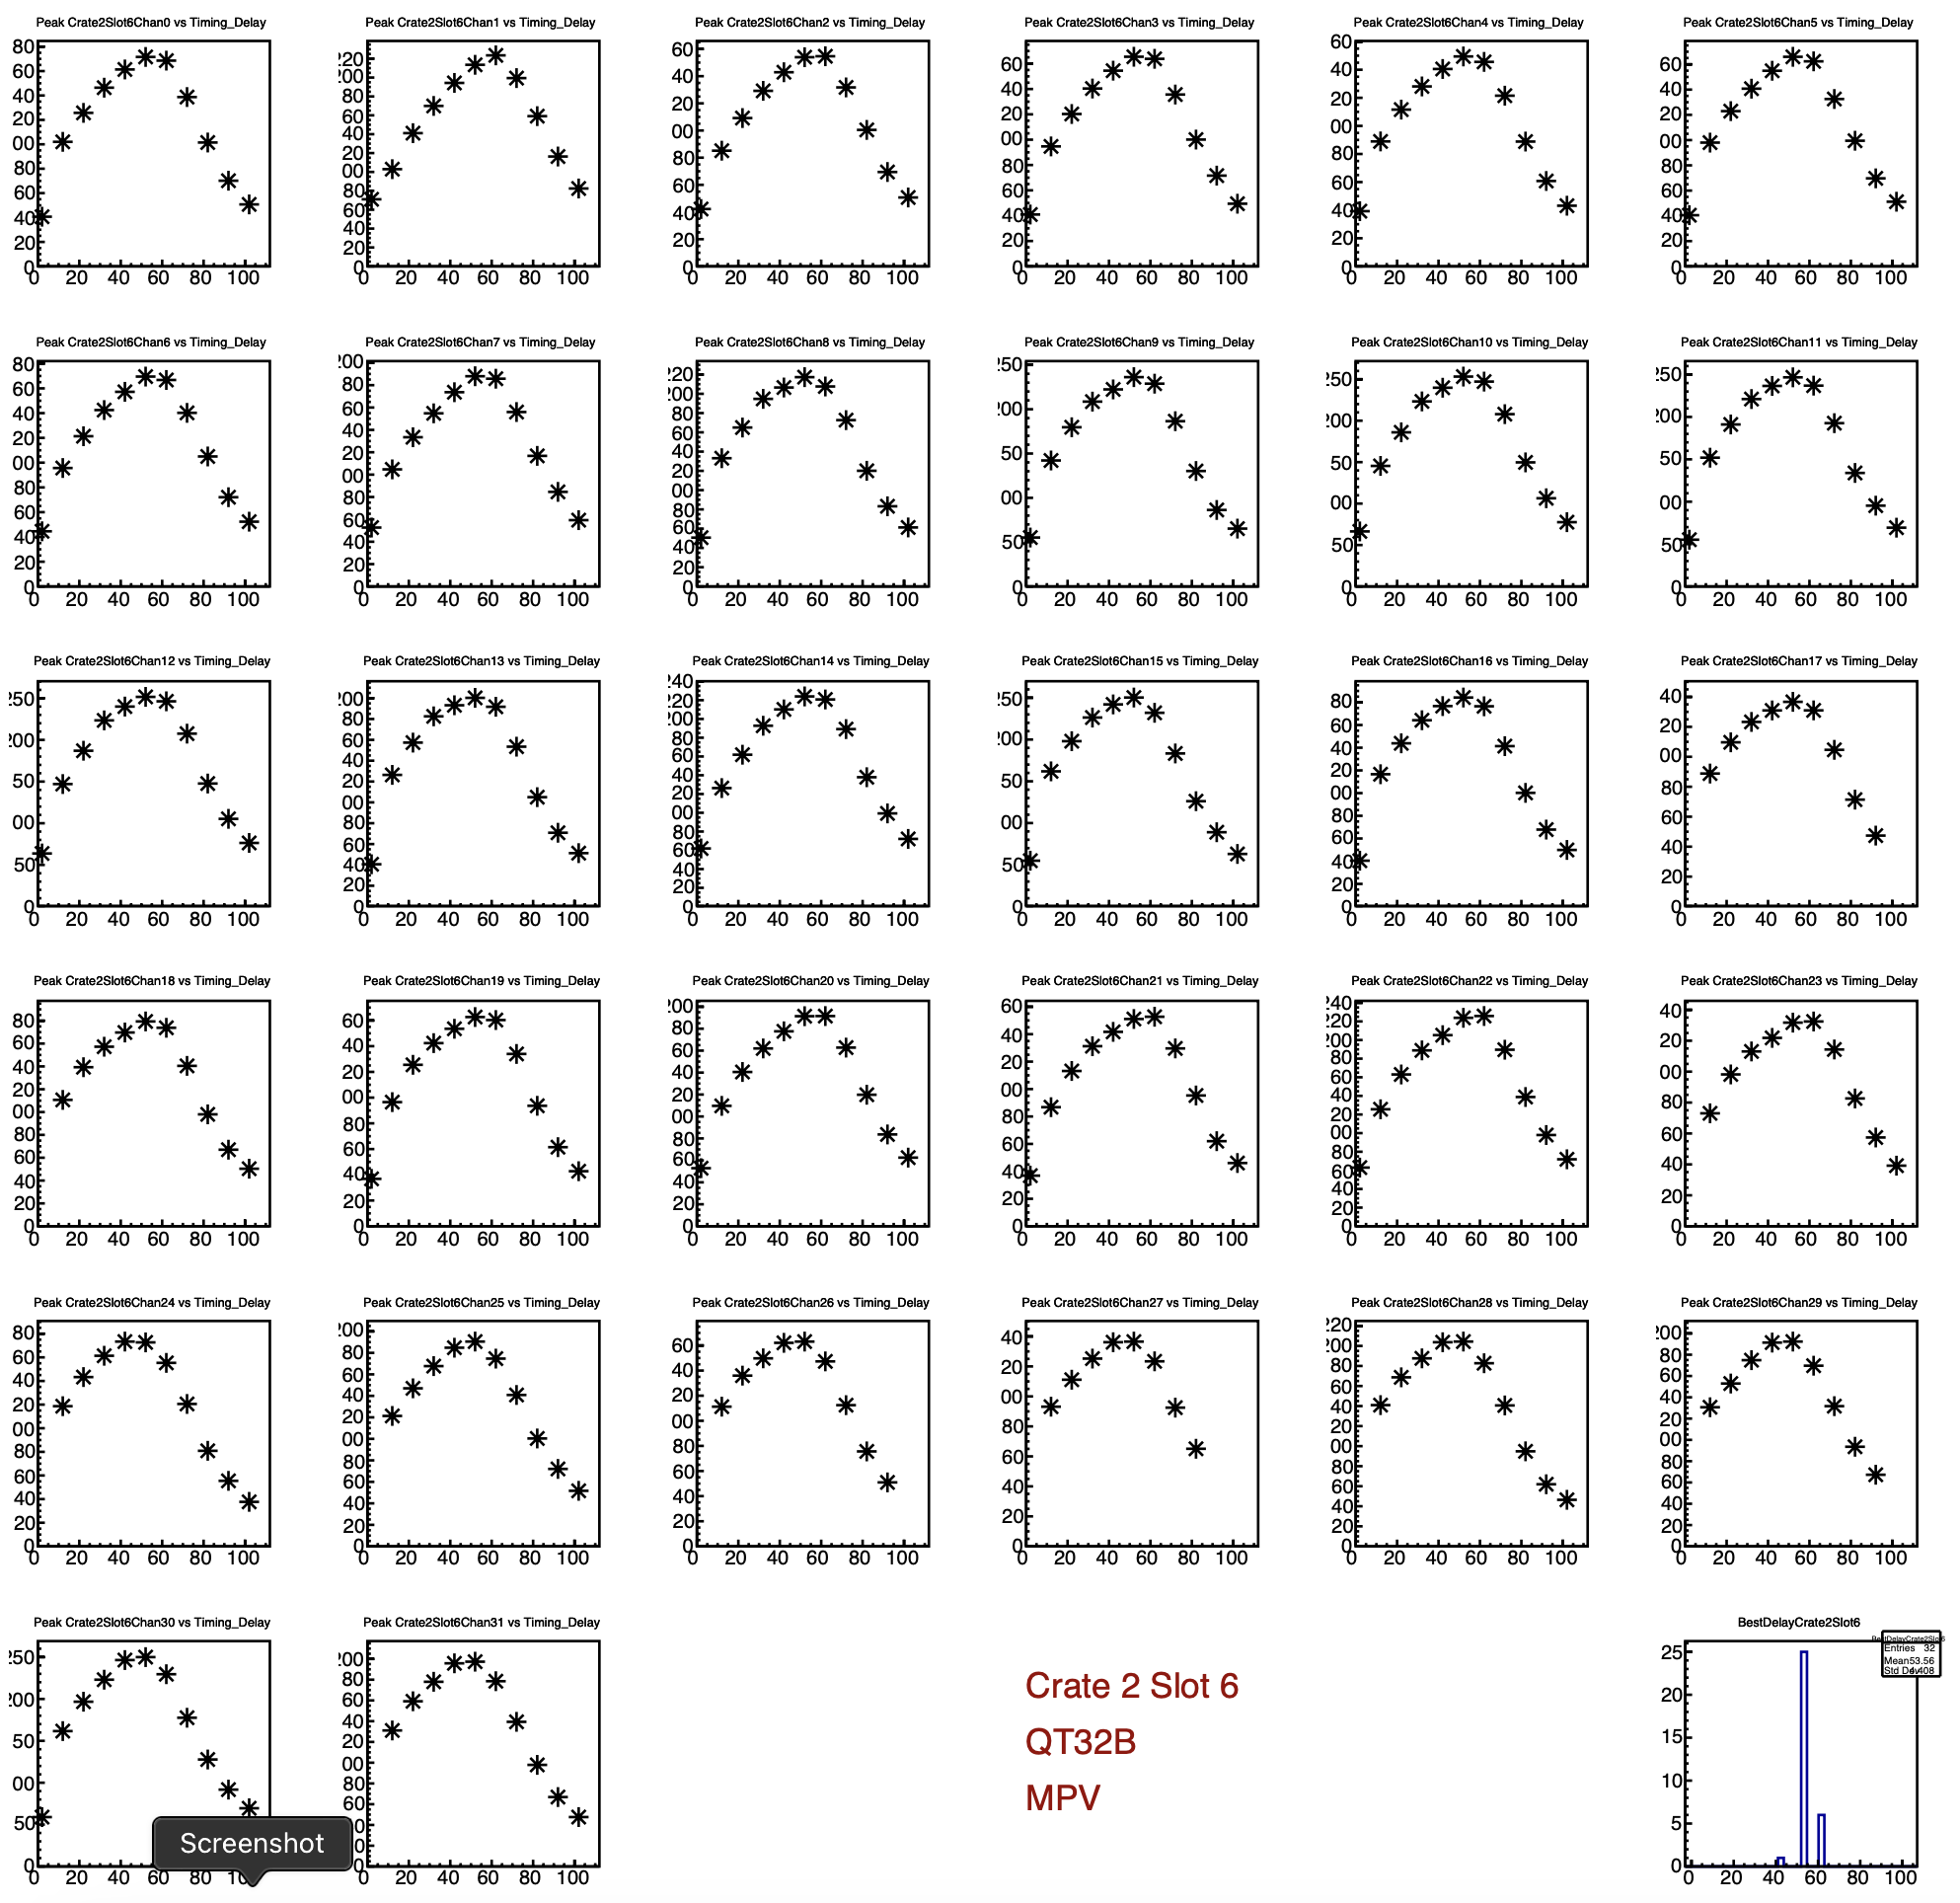
An example for an East QTB board. Each panel represents one channel. The y-axis is the fitted MIP peak position, the x-axis is gate delay label value. The little panel at the bottom right is the distribution of gate_delay values that gives the maximum peak position, for the channels in this board only.
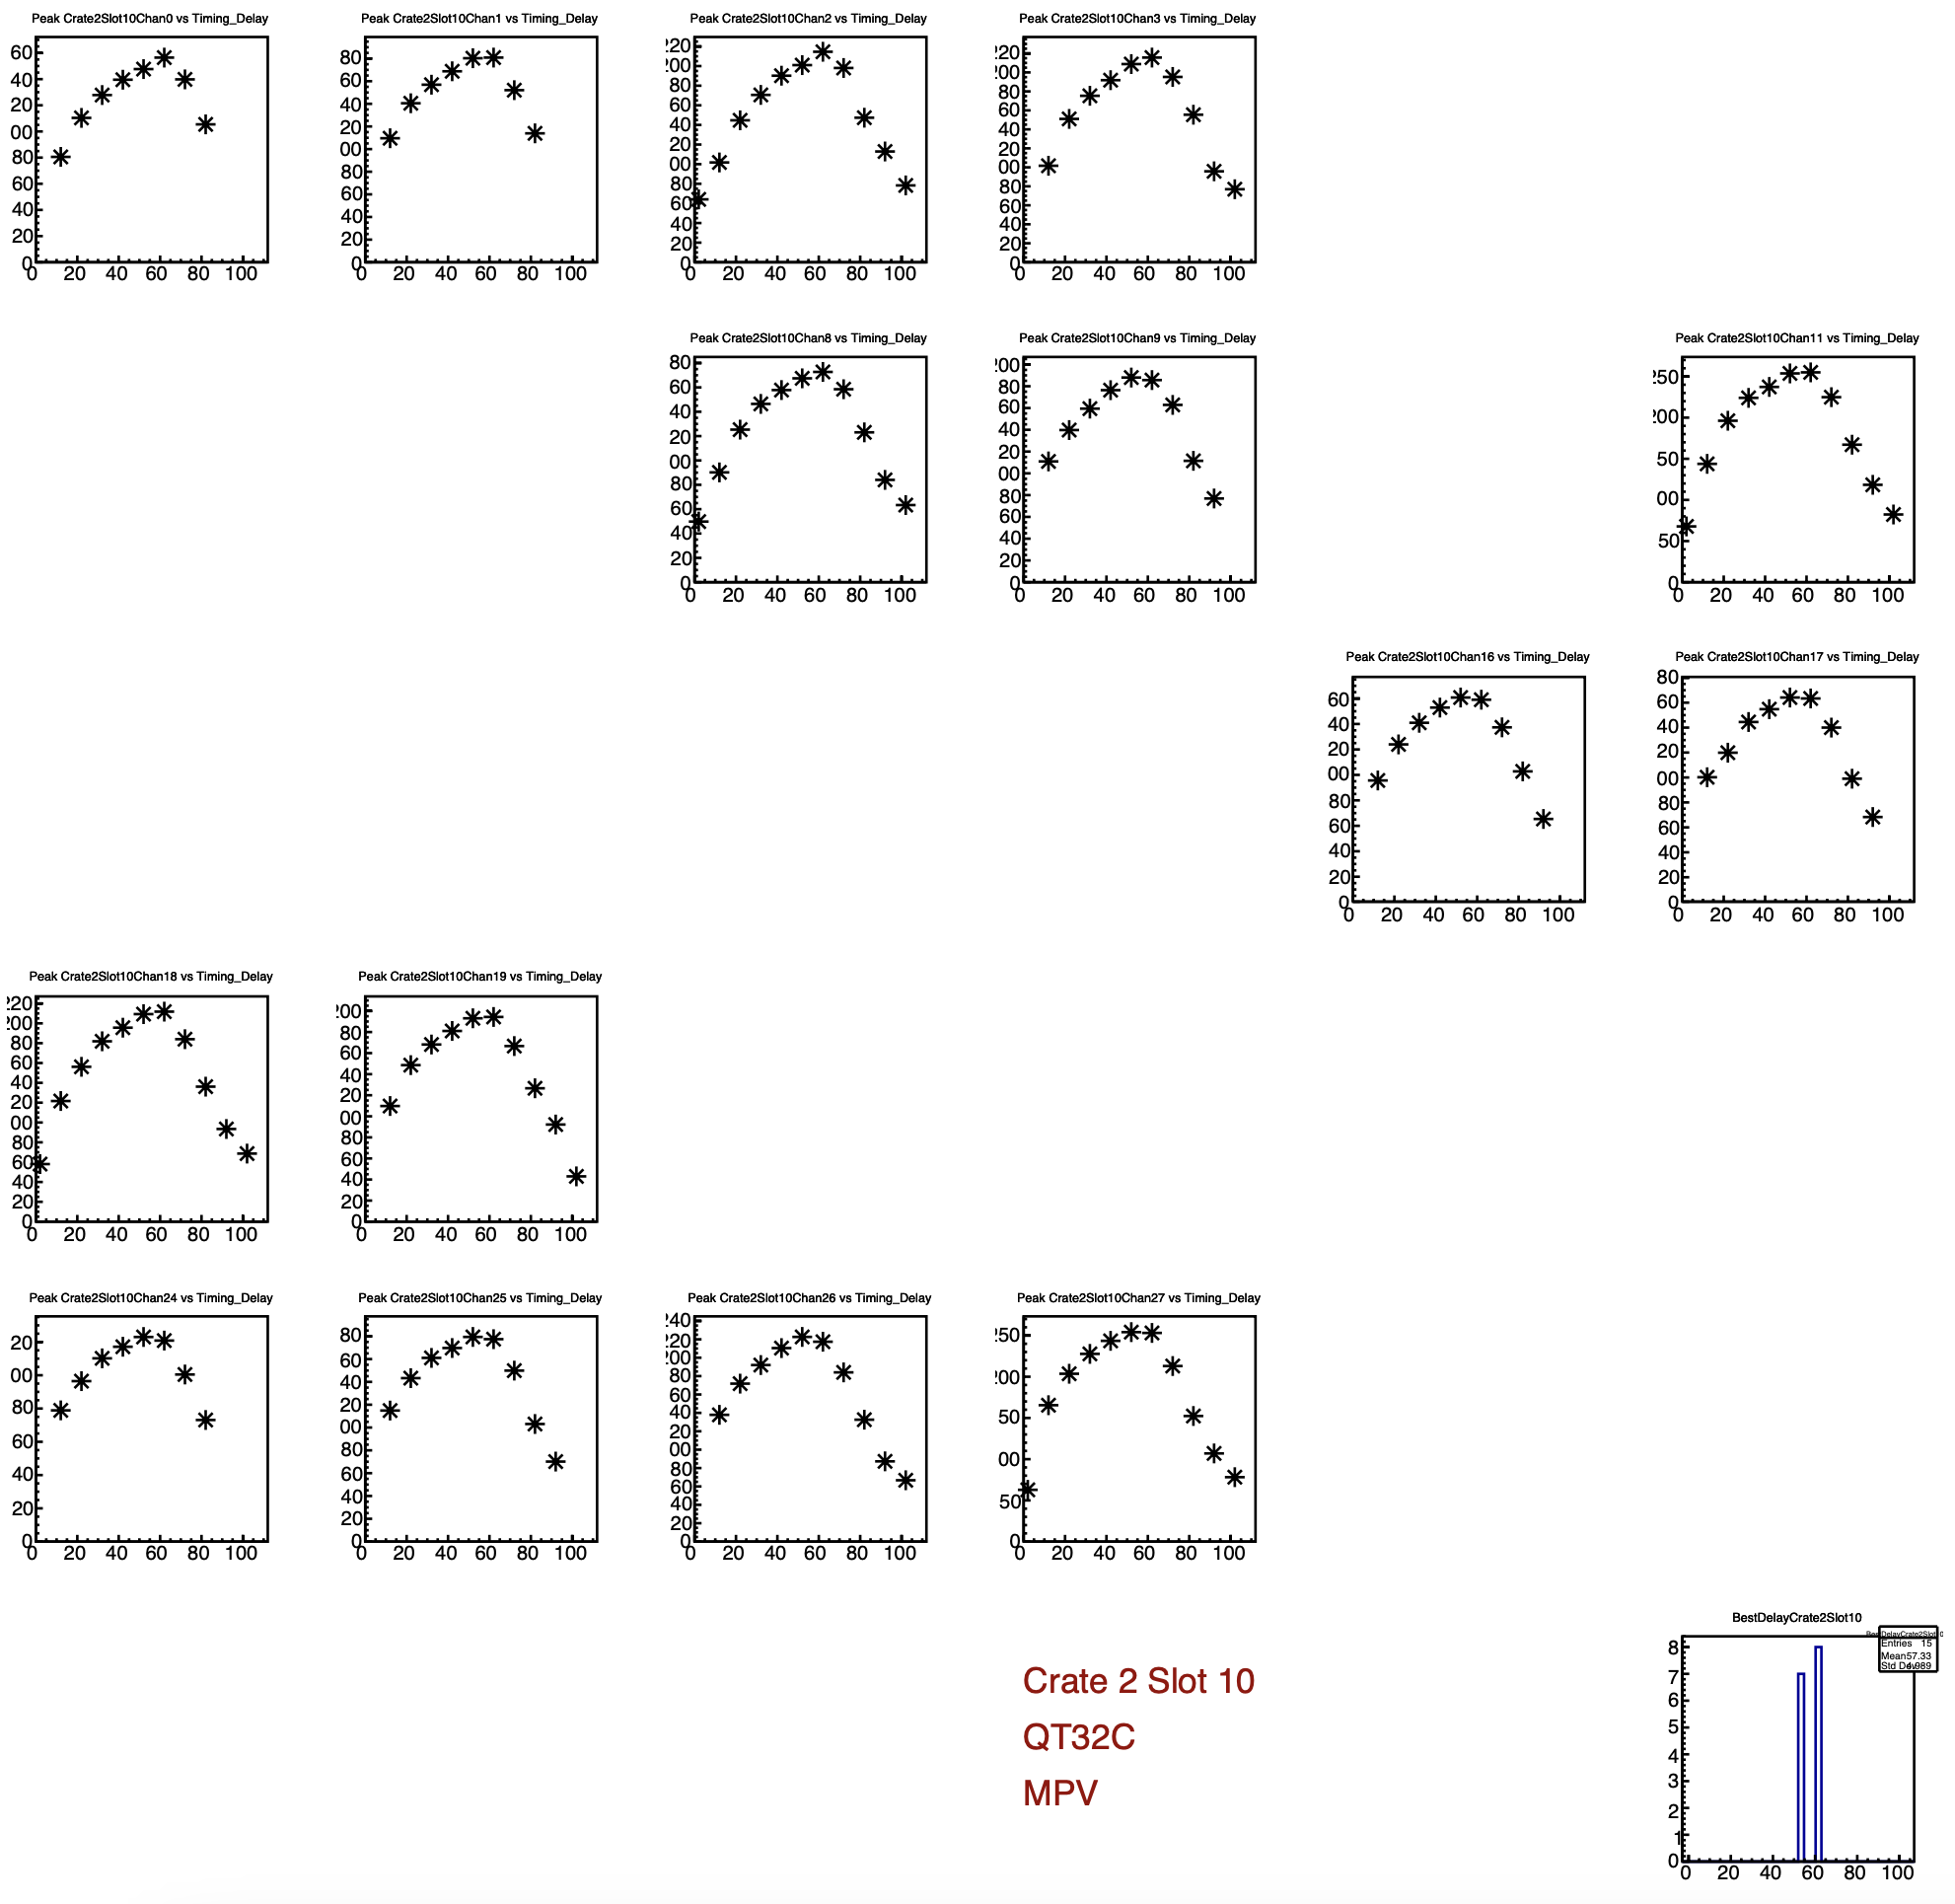
Here is the same thing, for a West QT32C
Summarizing the above graphs even further, we come to the distributions within each category. These graphs tell us what are the "best" values for the labels:
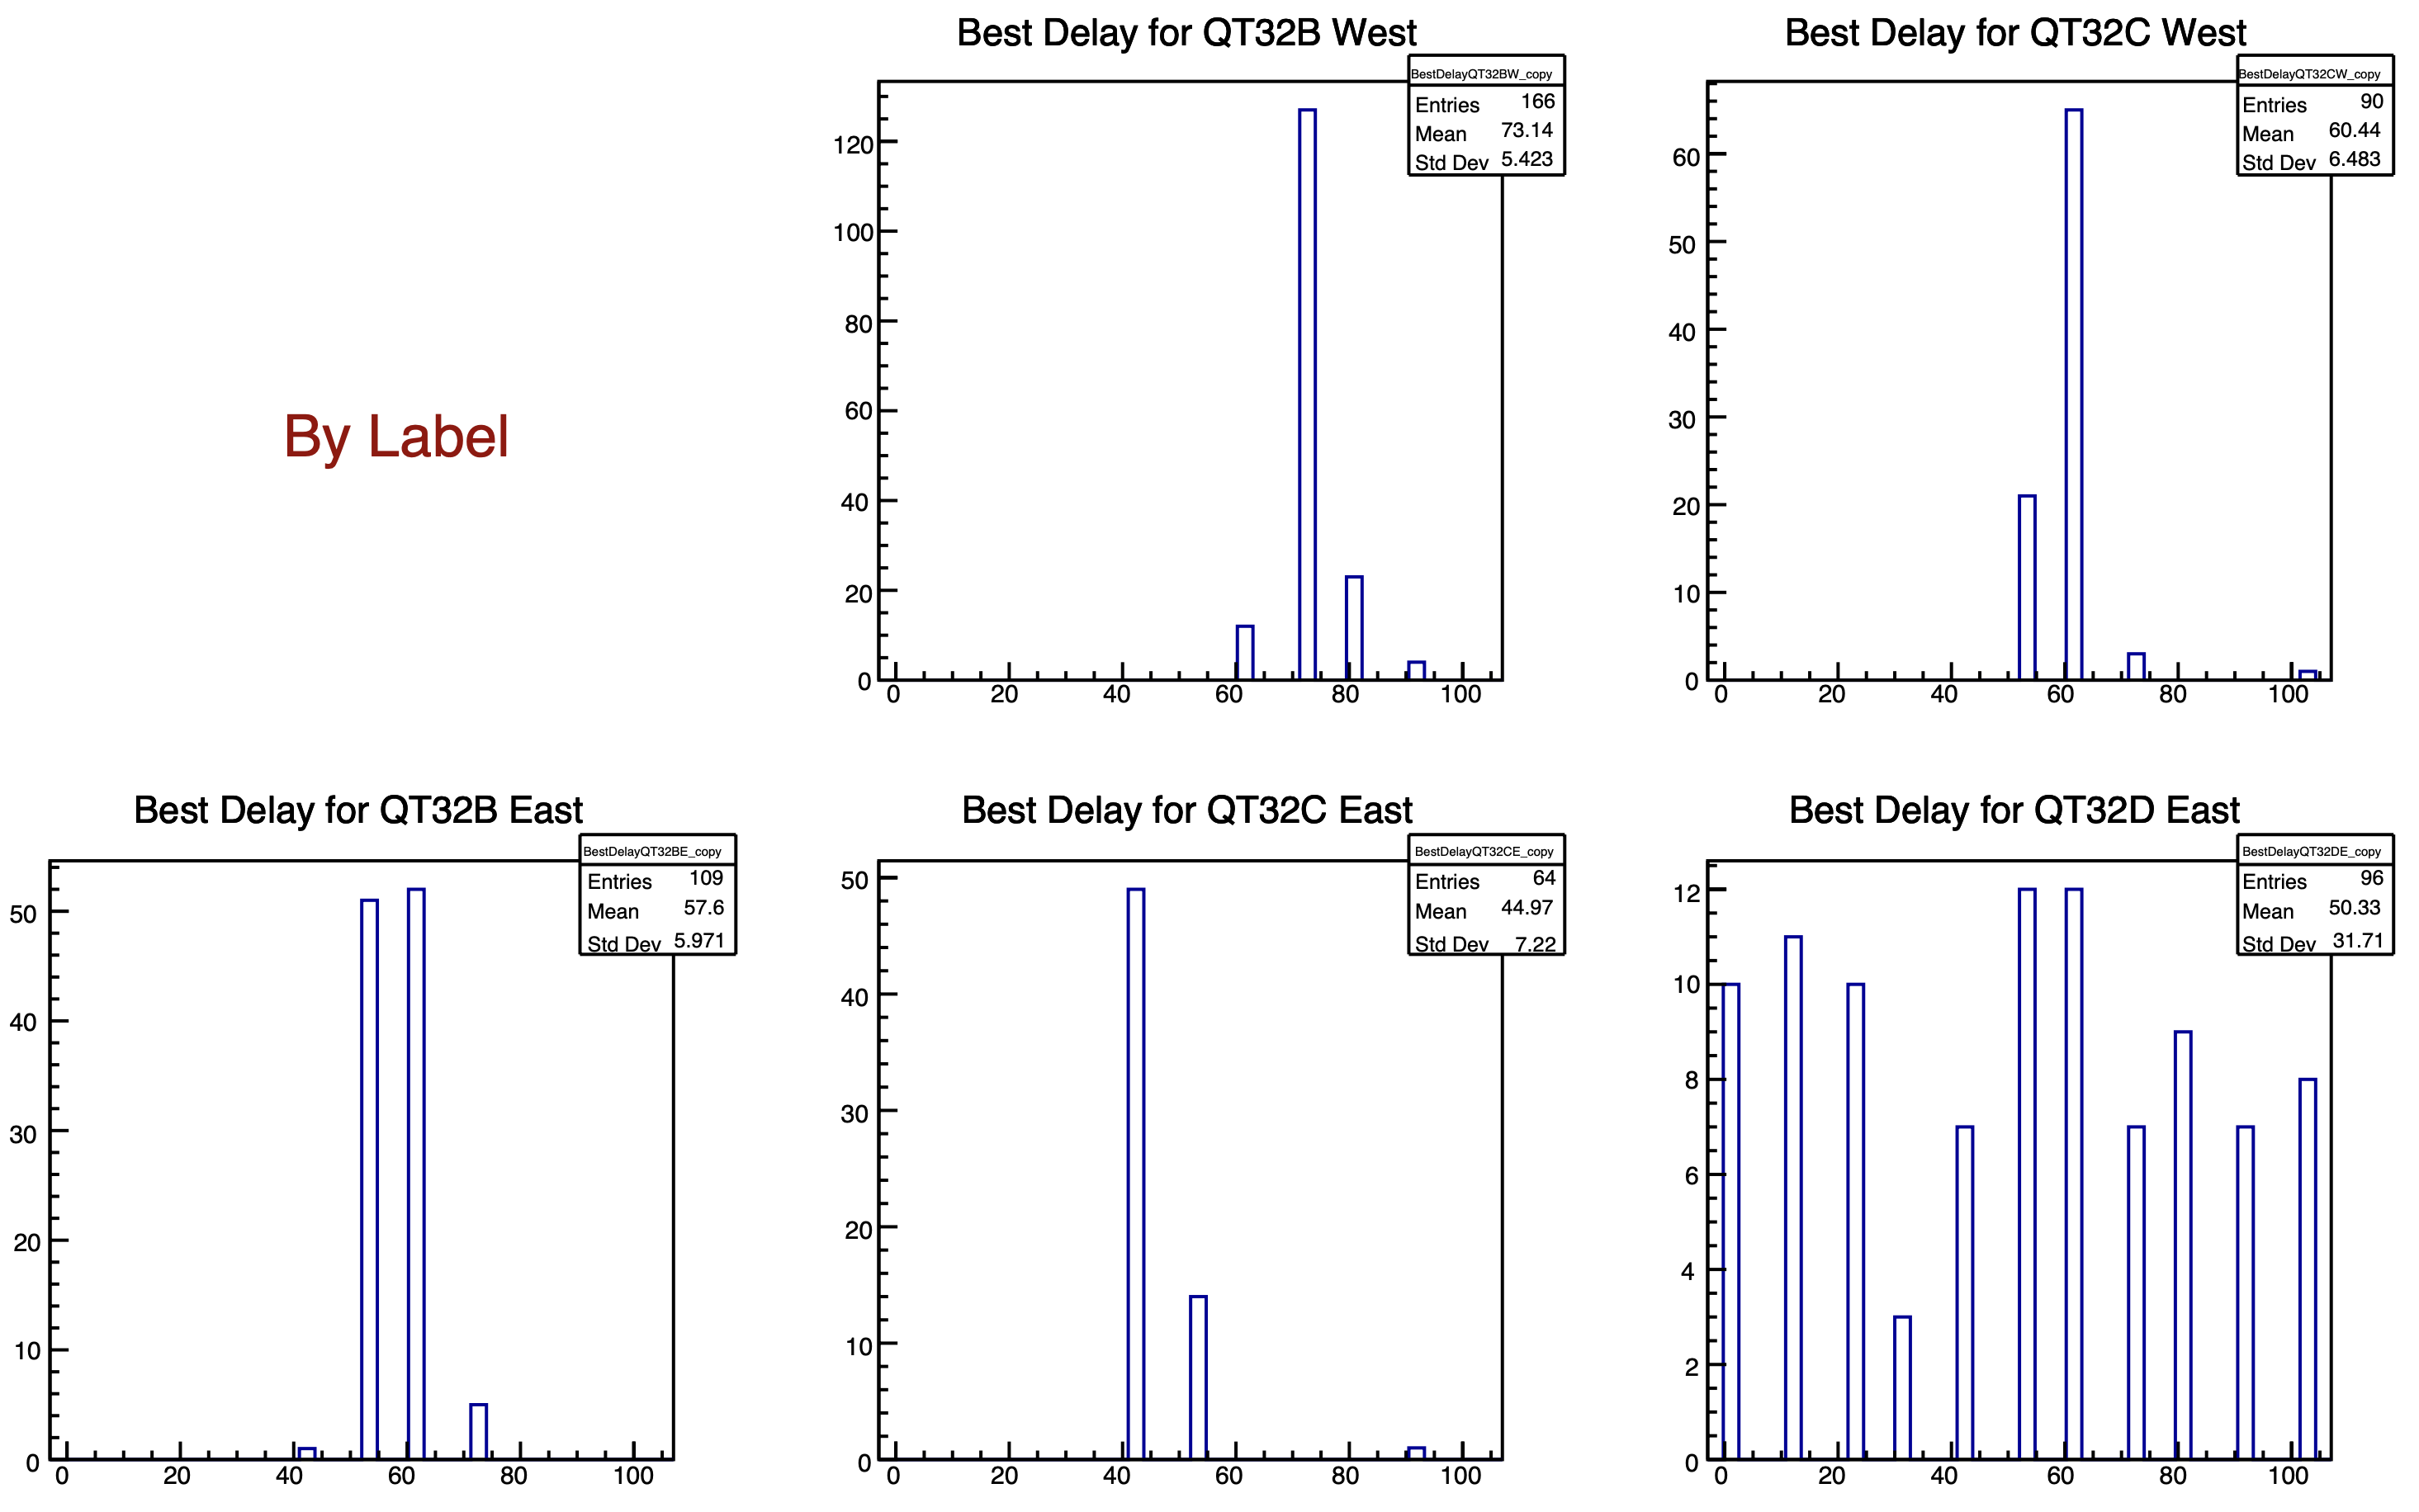
Since trigger timing is determined by "fastest C," we choose a slightly lower value for the gate_delay_QT32C than the plot might indicate, so we don't miss a leading edge because it falls outside the gate.
Executive summary:
The proper labels are as follows:
- East_QTB_Start_Delay = 57
- East_QTC_Start_Delay =40
- East_QTD_Start_Delay could not be determined
- West_QTB_Start_Delay =72
- West_QTC_Start_Delay =52
This analysis is performed on histogram files produced by Maria who ran a code written by Rosi. The analysis macro is pretty nontrivial, and is attached to this page at the bottom (or click here).
Also, the macro makes a giant 850-page pdf file which contains all the details, including all the figures shown below. It is also attached at the bottom of this page (or click here).
Setup
This year, the EPD electronics changed in two ways. The first is the rearrangement of QT32s into four crates, instead of 3. The second is the introduction of yet another flavor of QT32: QT32D now joins the QT32B and QT32C groups.For the record, here are the layouts of the four crates. Slots 0-6 host East-side QTs and 8-14 host West-side QTs.
| slot: | 0 | 2 | 4 | 6 | 8 | 10 | 12 | 14 |
|---|---|---|---|---|---|---|---|---|
| EQ1 | C | D | B | B | C | C | B | B |
| EQ2 | C | C | D | B | C | C | B | B |
| EQ3 | C | C | B | D | C | C | B | B |
| EQ4 | C | C | B | D | C | B | B | B |
Scan details.
- bias voltages were all set to Vset=60
- 11 runs of 500k minbias events (trigger only read out) were taken, with labels (all the same) set to 2,12,22,...102
- Landau fit to MIP peaks. We look for the maximum, channel-by-channel, then board-by-board, then category-by-category. Here, "category" refers to one of the 5 labels: East_QTB, East_QTC, East_QTD, West_QTB, West_QTC
Results 1 - MIP peaks
All QTBs in EQ1-3 showed nice MIP peaks. Here is a representative case. Each panel corresponds to one run (i.e. one value of the Start_Delay):
Similarly, all QTCs in EQ1-3 showed nice MIP peaks. Here is a representative example:
None of the QTDs showed a MIP peak, for any value of gate delay. Here's an example:
Results 2 - Dependence of peak position on gate_delay.
An example for an East QTB board. Each panel represents one channel. The y-axis is the fitted MIP peak position, the x-axis is gate delay label value. The little panel at the bottom right is the distribution of gate_delay values that gives the maximum peak position, for the channels in this board only.
Here is the same thing, for a West QT32C
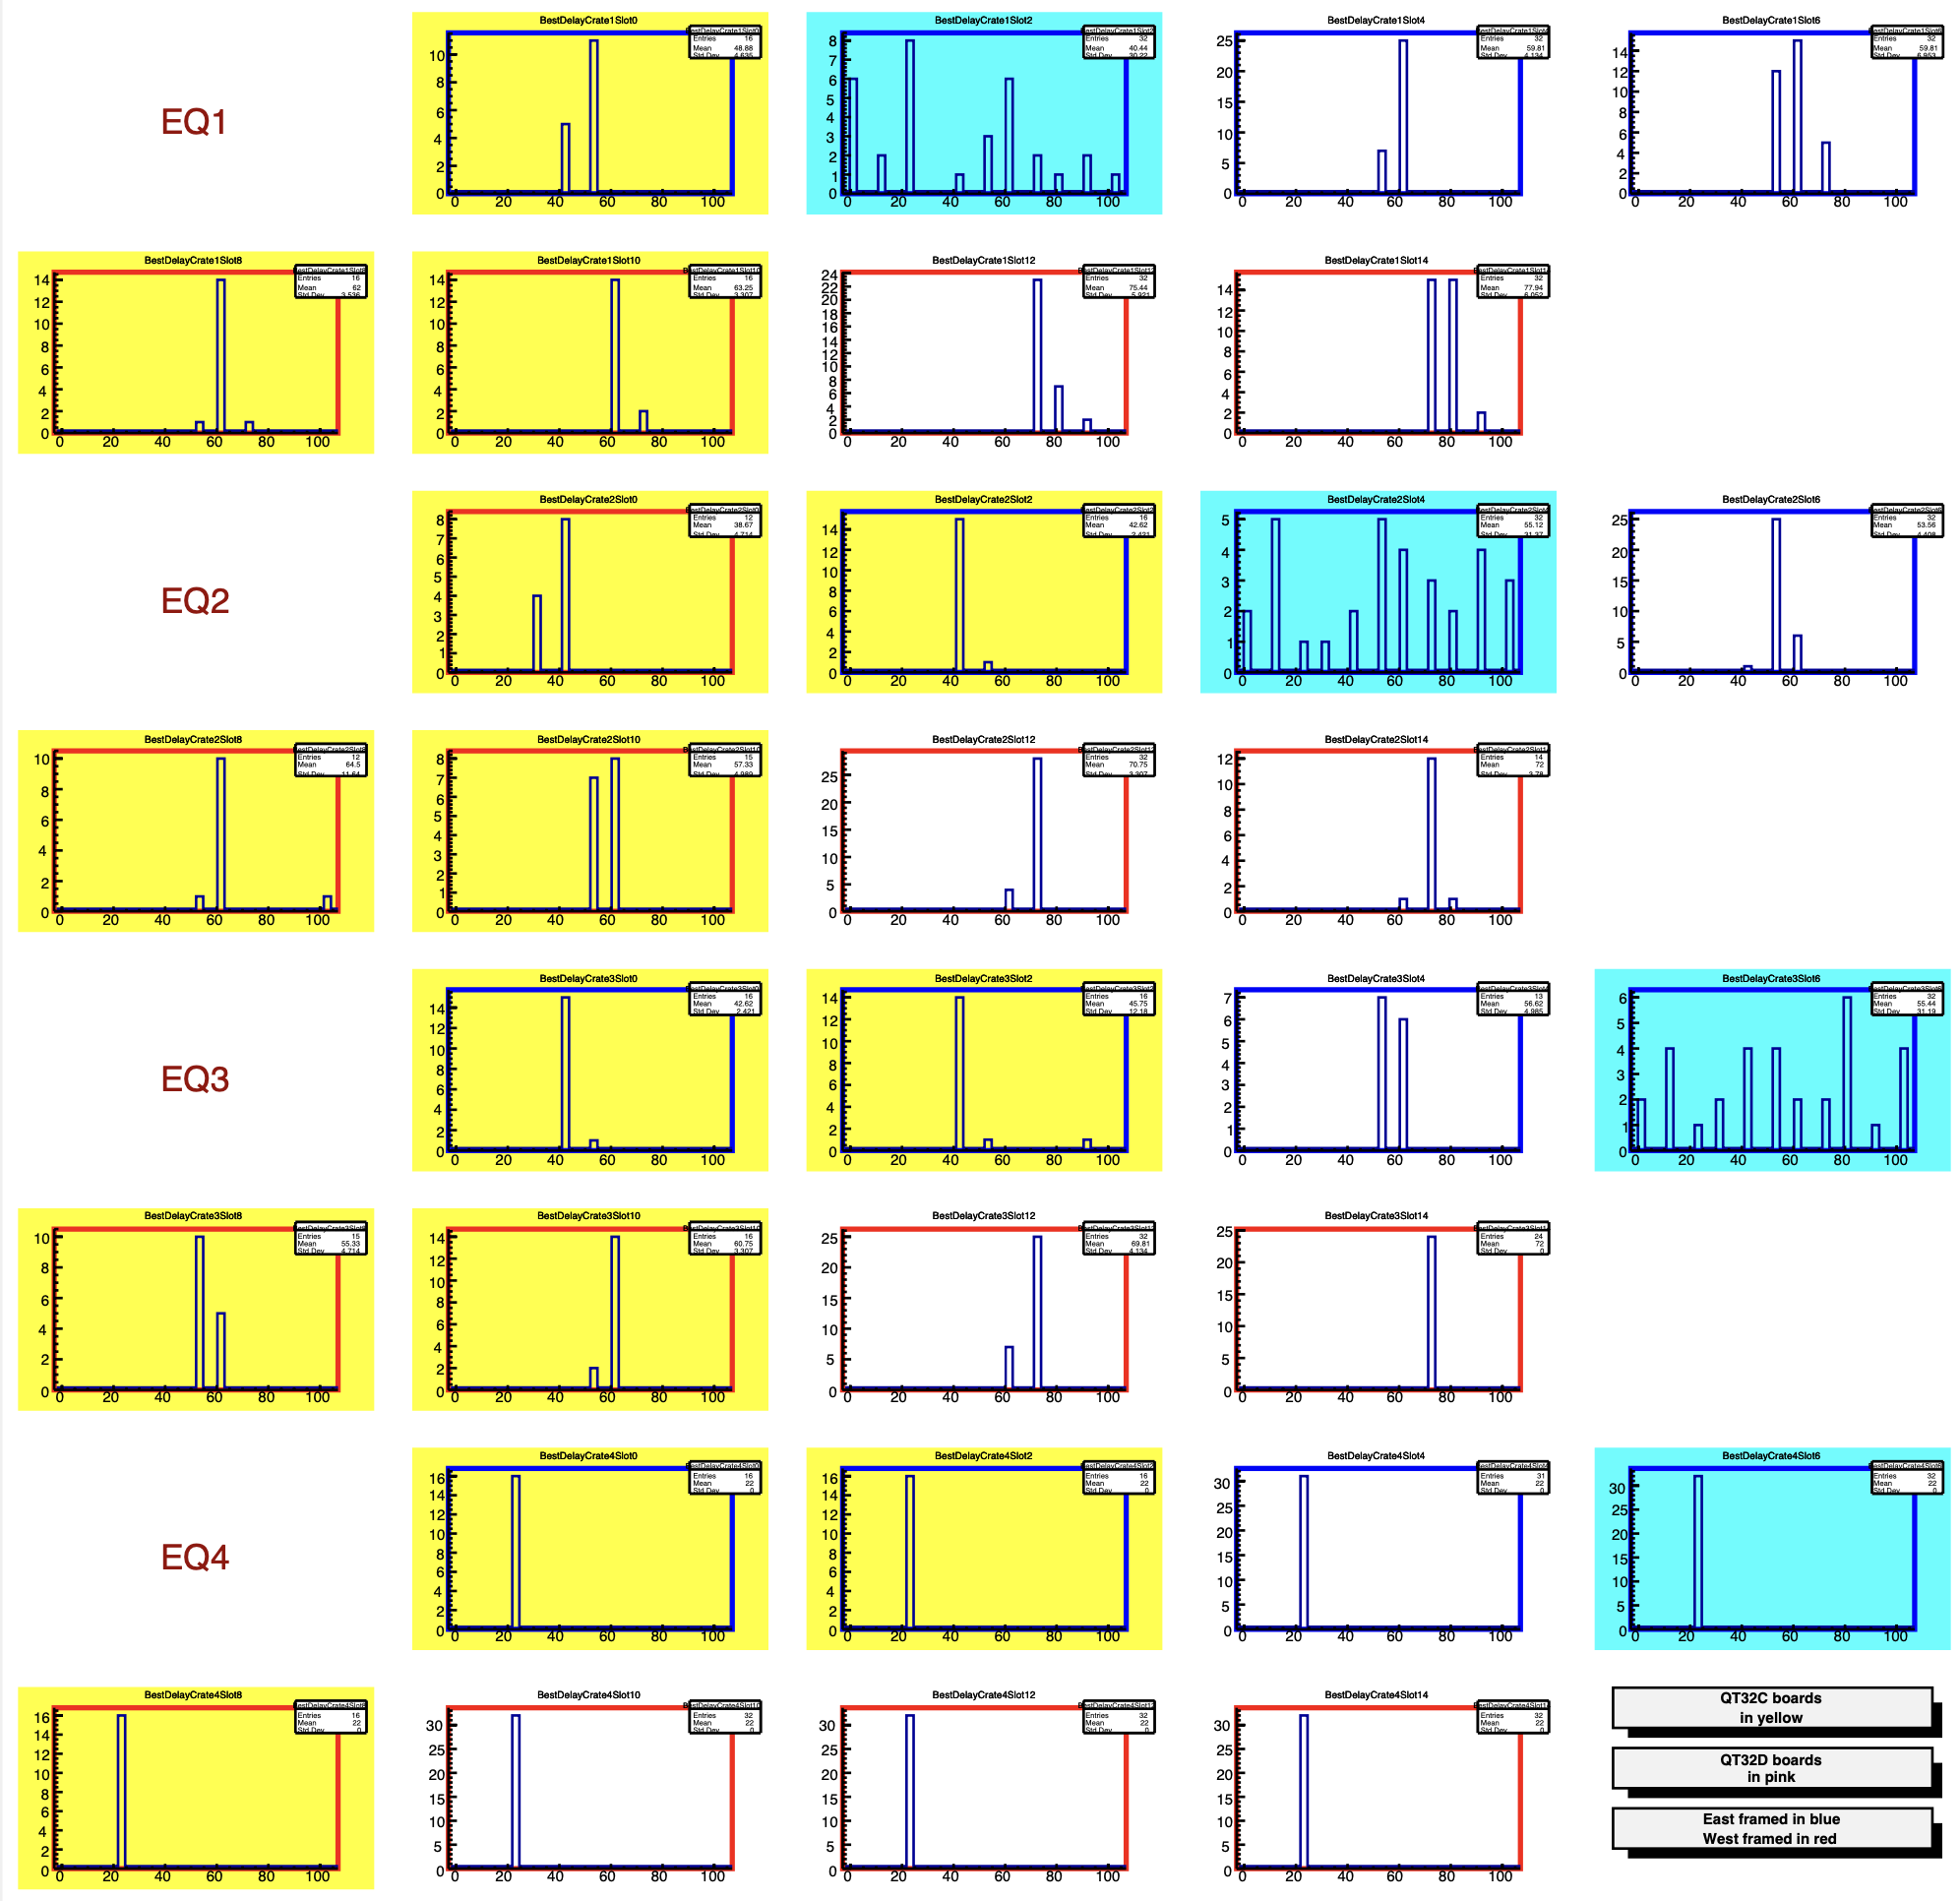
Results 3 - Overview of all the crates
- Background color indicates QT flavor: White=B / Yellow=C / Blue=D
- Frame color indicates East/West: Blue=East / Red=West
- Ignore EQ4, which would not configure so was excluded from the run.
Results 4 - "Best" values for each category
Summarizing the above graphs even further, we come to the distributions within each category. These graphs tell us what are the "best" values for the labels:
Since trigger timing is determined by "fastest C," we choose a slightly lower value for the gate_delay_QT32C than the plot might indicate, so we don't miss a leading edge because it falls outside the gate.
»
- lisa's blog
- Login or register to post comments