Doing a multi-MIP Landau fit
Updated on Sat, 2020-04-11 17:27. Originally created by lisa on 2018-04-27 17:09.
The macro has been updated. It wasn't a "bug," per se, but doing TConvolution requires a larger defined function range, to reduce "edge effects" (wrap-around). At the bottom, I have identified the original macro as "Original" and the updated one as "Updated11April2020".
Don't worry, this isn't a big thing, unless you are doing a detailed study. Calibrations are fine.
I have shown multiple-MIP fits using convoluted Landau distributions many, many times. Often, I am fitting hundreds or even a few thousand ADC (or calibrated ADC, a.k.a. "nMIP") distributions, in a big loop, and keeping track of thousands of fit parameters, and "automatically" determining fit range etc etc. The codes then get pretty complicated, and I usually don't post them.
But I think folks might like a nice, clean, simple code which will do and plot these fits, without so many bells and whistles. That is what is provided here. You have to provide a distribution (either calibrated or uncalibrated ADC), a starting value for the MIP peak (trivial to find by eye), and a range where you want the fit done. Then you can elaborate on this thing however you like.
The updated macro is here: drupal.star.bnl.gov/STAR/system/files/MultiLandauFit.C_0.txt
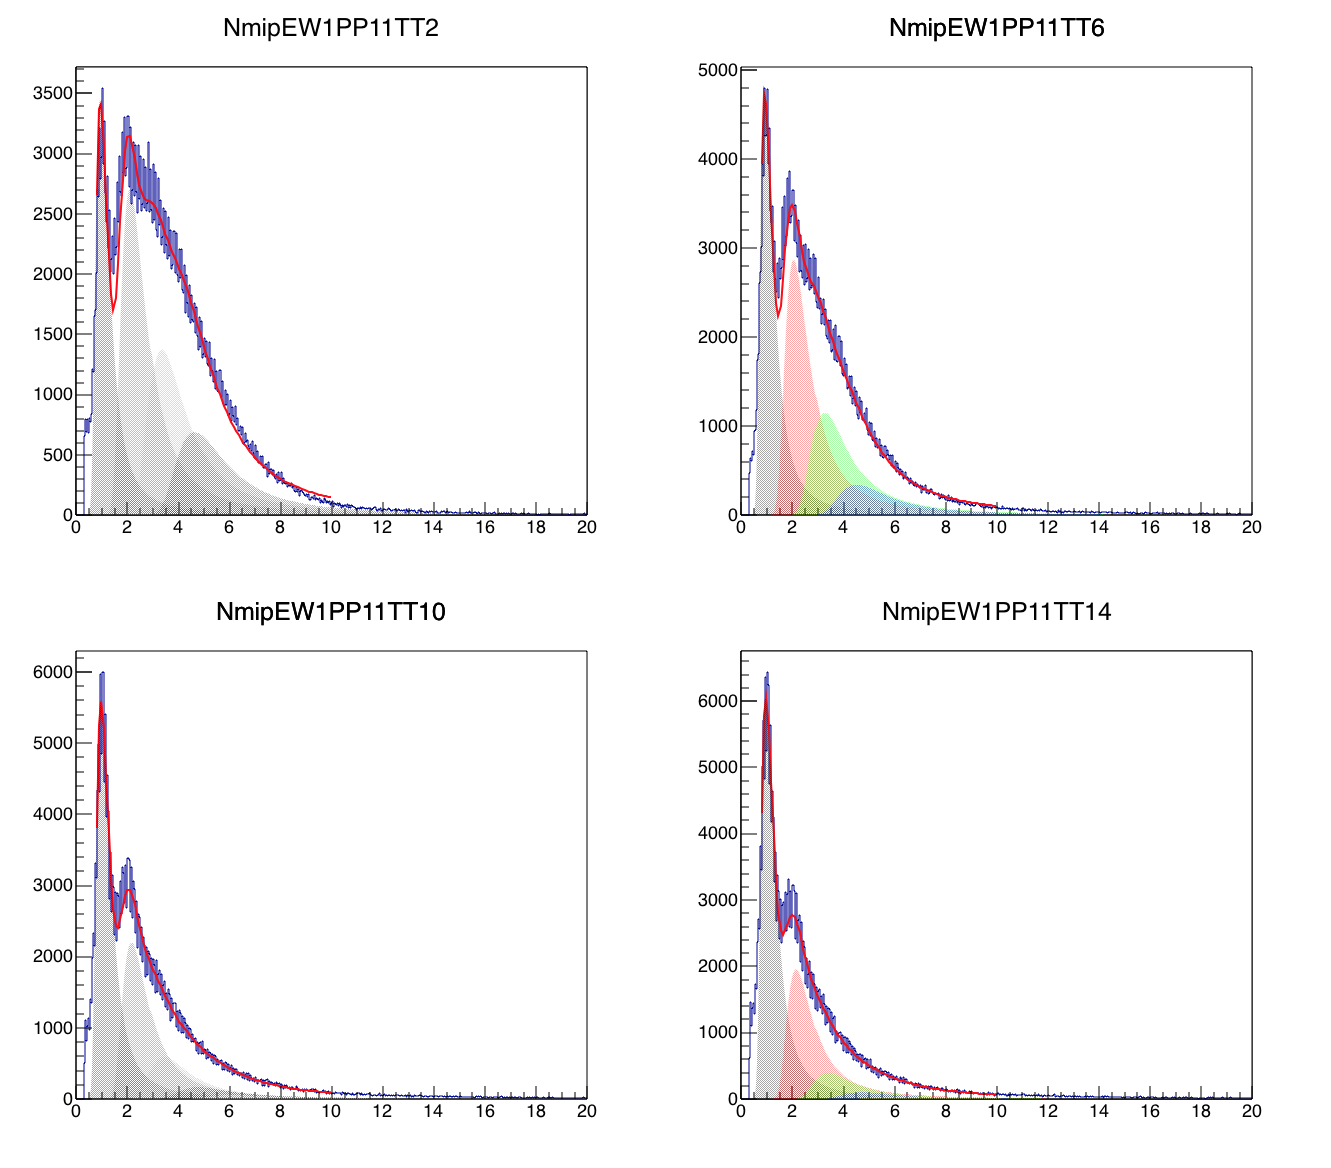
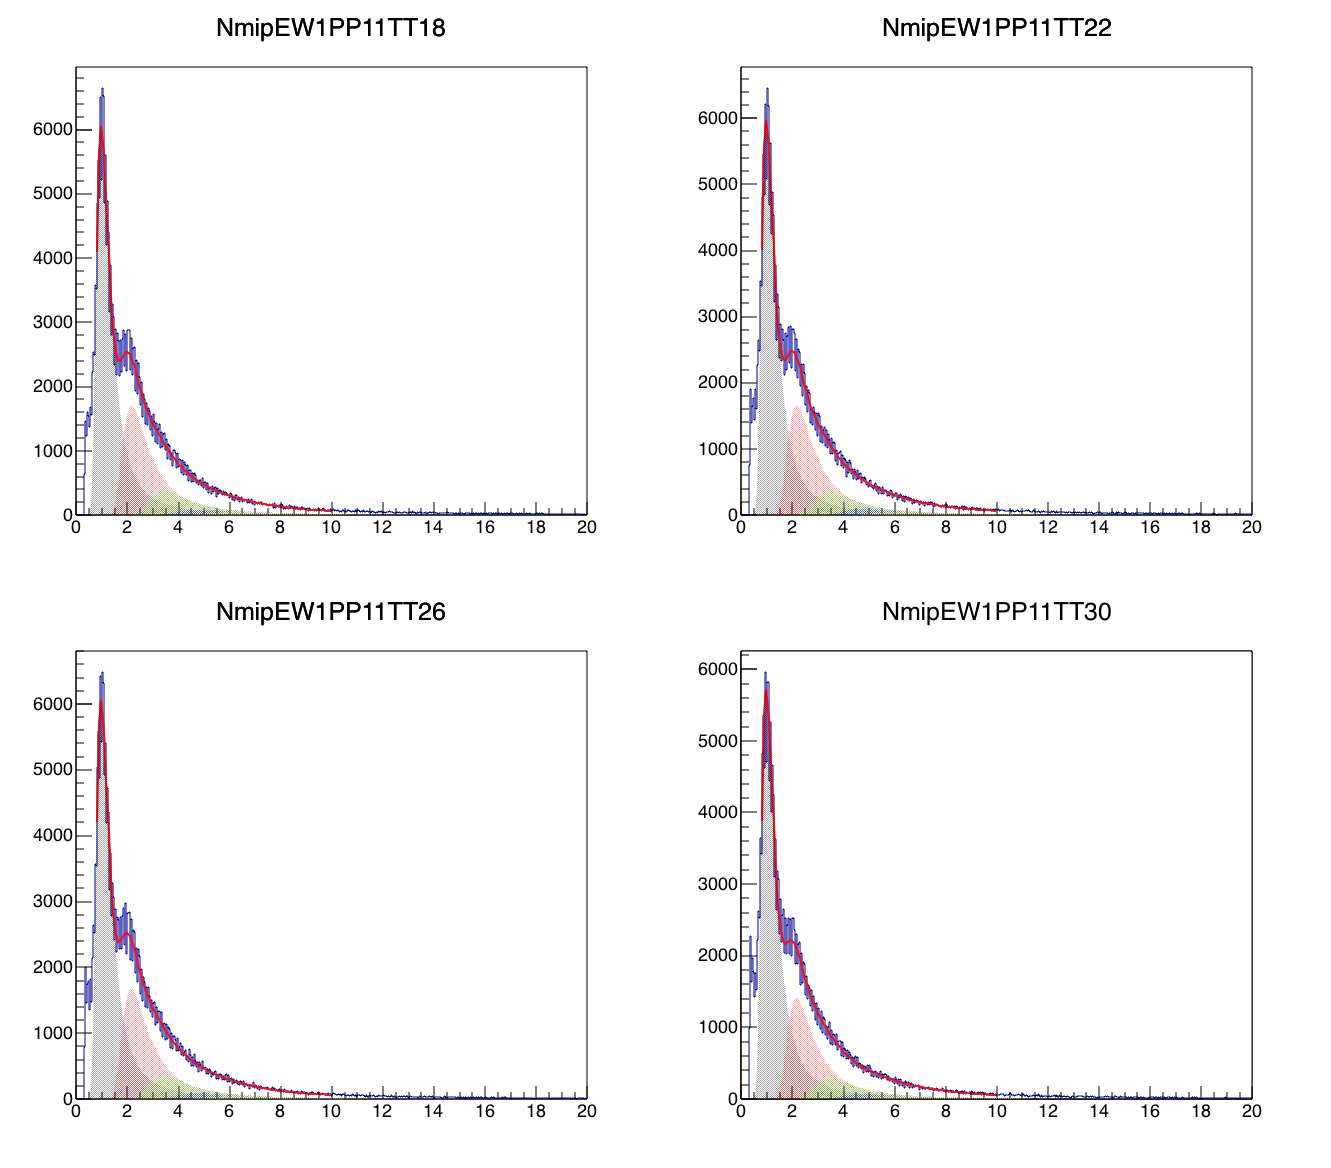
Here are some examples from the 2018 isobar run, for RefMult>100 events (which isn't a super-central cut) for West PP11, tiles 2, 6, 10, 14, 18, 22, 26, 30. For the innermost rings, we have more 2-MIP events than 1-MIP events.


Update 11 April 2020.
The macro has been updated. It wasn't a "bug," per se, but doing TConvolution requires a larger defined function range, to reduce "edge effects" (wrap-around). At the bottom, I have identified the original macro as "Original" and the updated one as "Updated11April2020".
Don't worry, this isn't a big thing, unless you are doing a detailed study. Calibrations are fine.
The original post from 2018
I have shown multiple-MIP fits using convoluted Landau distributions many, many times. Often, I am fitting hundreds or even a few thousand ADC (or calibrated ADC, a.k.a. "nMIP") distributions, in a big loop, and keeping track of thousands of fit parameters, and "automatically" determining fit range etc etc. The codes then get pretty complicated, and I usually don't post them.
But I think folks might like a nice, clean, simple code which will do and plot these fits, without so many bells and whistles. That is what is provided here. You have to provide a distribution (either calibrated or uncalibrated ADC), a starting value for the MIP peak (trivial to find by eye), and a range where you want the fit done. Then you can elaborate on this thing however you like.
The updated macro is here: drupal.star.bnl.gov/STAR/system/files/MultiLandauFit.C_0.txt
Here are some examples from the 2018 isobar run, for RefMult>100 events (which isn't a super-central cut) for West PP11, tiles 2, 6, 10, 14, 18, 22, 26, 30. For the innermost rings, we have more 2-MIP events than 1-MIP events.


»
- lisa's blog
- Login or register to post comments
