Figures for JH's talk at AUM showing EPD uniformity
Updated on Wed, 2018-06-13 18:02. Originally created by lisa on 2018-06-13 17:42.
J.H. and Akio requested some plot showing the strong uniformity of tile response. I've made many such plots on previous pages, but I thought I'd fix up something nice. It is J.H., after all.....
This is from isobar collisions with RefMult > 100.
Attached at the bottom of this page are better resolution images, including a 5-page pdf file and 5-slide powerpoint file.
Important points about these spectra:

This is from isobar collisions with RefMult > 100.
Attached at the bottom of this page are better resolution images, including a 5-page pdf file and 5-slide powerpoint file.
Important points about these spectra:
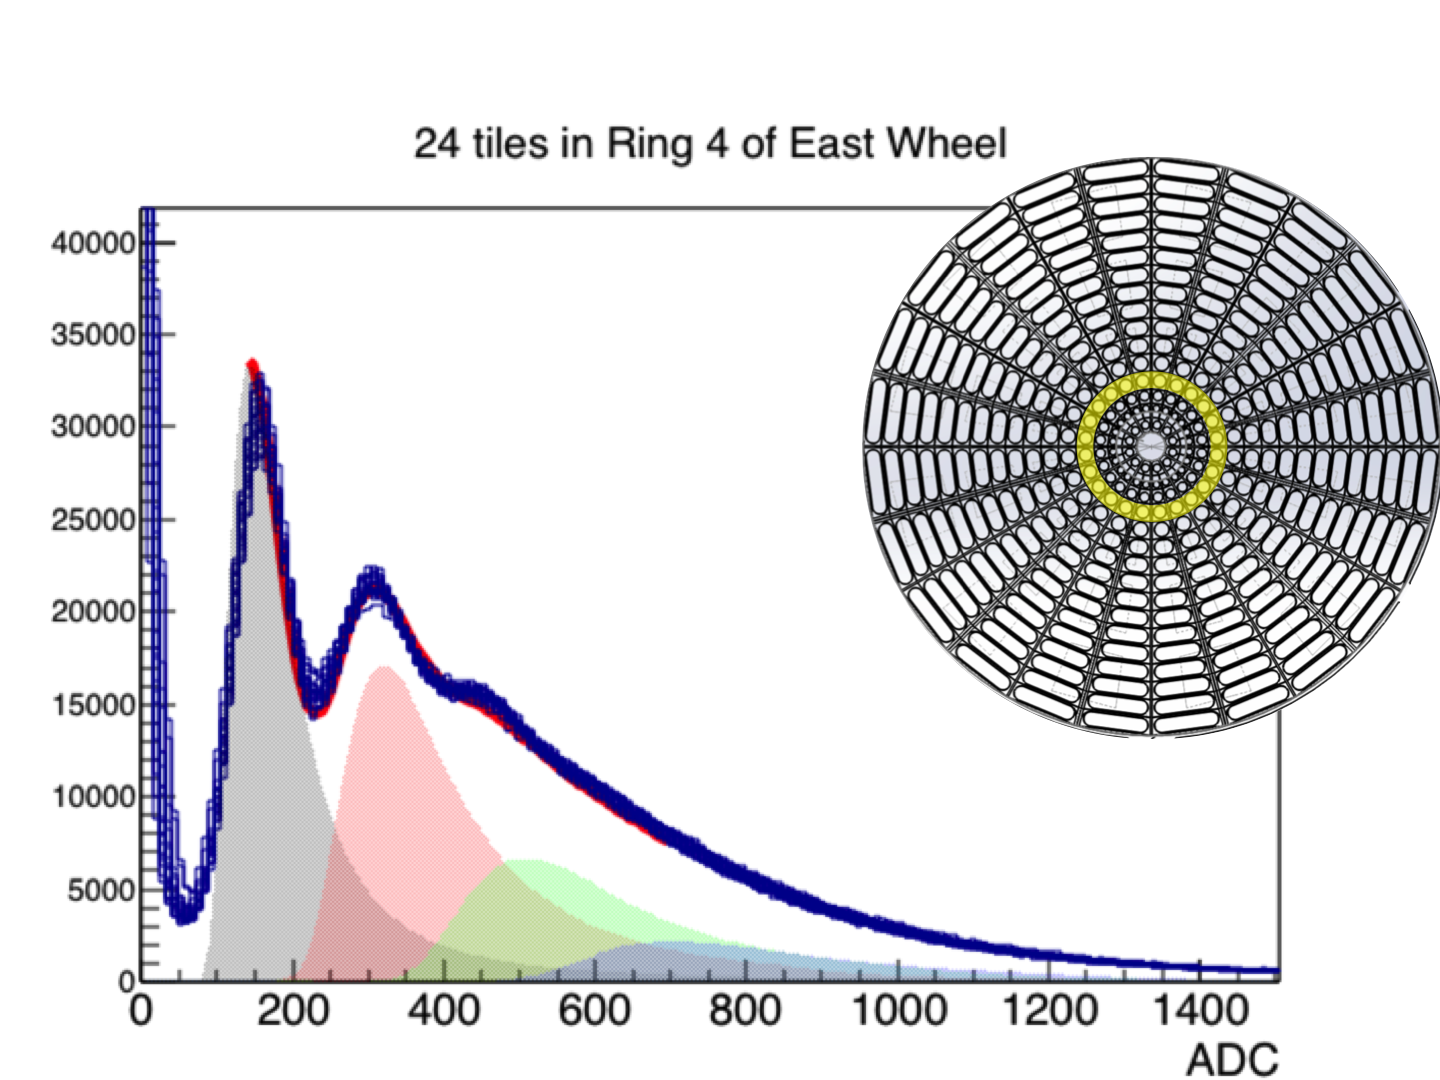
- These are the ADC spectra from all 24 tiles at a given radius, just piled on top of each other. The multiple-Landau fit is fit to just one (at PP01). I wouldn't worry that the fit isn't absolutely perfect. It definitely shows that things make sense. The red line shows the fit. The shaded areas show the contribution from 1-, 2-, 3-, 4-MIP events.
- they are raw ADC spectra. No normalization of any kind, either in the horizontal or vertical axes. The gains were matched at the beginning of the run in February, by adjusting individual bias voltages. A small amount of offline calibration will be done, but this is raw.
- (Note that the inner 5 rings use QT32Cs, which have higher intrinsic gain than the QT32Bs, so the peaks are at higher ADC value)
- I show the East side rather than the West, because the fixed-target holder means more counts at the bottom of the West EPD wheel. This is easily accounted for in the analysis, but it screws up plots like these.
- A final note: some of the rings had outliers that we will need to calibrate offline. The ones I'm showing here are among the "nicest," since we are trying to show nice plots.
»
- lisa's blog
- Login or register to post comments