Flow decorrelation in Isobar collisions 2018
Updated on Sat, 2018-12-22 10:23. Originally created by lisa on 2018-12-20 11:20.
Xiaoyu Liu has done some nice studies of n=2 flow decorrelations in 27 GeV Au+Au and 200 Gev Zr/Ru+Zr/Ru (isobar) collisions taken in 2018. Her presentation at the December Analysis Meeting may be found here.
As she did, here I look only at the available fast-offline data, which is about 1M Au+Au and 5.4M isobar collisions (before cuts on vertex, etc). There are not enough statistics for a detailed Au+Au study, so here I study the isobars.
Xiaoyu saw some discrepancy in the decorrelation ratio, r, when using the East and West EPD wheel as reference. In particular, there was apparently larger flow decorrelation with East than with West. We speculated that maybe it was due to the fixed-target holder, but honestly it was a mystery. Here, I start to make the case that the problem isn't with the EPD, but rather an East-West issue in the TPC, which in fact may arise from the single iTPC sector installed on the East side.
Here are my centrality cuts based on uncorrected RefMult. They come from a real quick analysis by Isaac:
Here are three sets of images. Best if you set your screen so everything is side-by-side. Here, down blue triangles are East EPD and red up triangles are West EPD.
I'm not sure what's going on, but a few things are clear:
But why most noticeably for the more central collisions?
To reduce effects of the single iTPC sector on the East side, I impose a requirement pT>0.2 GeV/c on the TPC tracks. For such a mild cut, I'd say the effect is significant. Below are the same figures as above, except with pT>0.2.
.png)
.png)
.png)
Now, putting the figures without pT cut next to the same figure with pT cut: (These are the same figures as above, but rearranged.)
Figures 7 and 8 are the same as figures 1 and 4 above. <Q2TPC . Q2EPD> versus eta for eight centrality bins. The scale on the y-axis is fixed. Left: no pT cut; Right: TPC tracks have pT > 0.2 GeV/c.
Figures 9 and 10 are the same as figures 2 and 5 above. <Q2TPC . Q2EPD> versus eta for eight centrality bins, with vertical autoscaled and blown up to focus on the the main TPC range. Left: no pT cut; Right: TPC tracks have pT > 0.2 GeV/c.
Figures 11 and 12 are the same as figures 3 and 6 above. the ratio "r" as a function of |eta|. vertical scale fixed. Left: no pT cut; Right: TPC tracks have pT > 0.2 GeV/c.
The effects of this quite mild pT cut are
Stronger pT cut
Here are the results for setting the pT cut to 300 MeV rather than 200 MeV. It seems like there is a little bit more improvement. The rest of this study I leave to Xiaoyu.
.png)
.png)
.png)
Confirming Xiaoyu's results
As she did, here I look only at the available fast-offline data, which is about 1M Au+Au and 5.4M isobar collisions (before cuts on vertex, etc). There are not enough statistics for a detailed Au+Au study, so here I study the isobars.
Xiaoyu saw some discrepancy in the decorrelation ratio, r, when using the East and West EPD wheel as reference. In particular, there was apparently larger flow decorrelation with East than with West. We speculated that maybe it was due to the fixed-target holder, but honestly it was a mystery. Here, I start to make the case that the problem isn't with the EPD, but rather an East-West issue in the TPC, which in fact may arise from the single iTPC sector installed on the East side.
Here are my centrality cuts based on uncorrected RefMult. They come from a real quick analysis by Isaac:
I am using the scalar product method, where the Q vector from both the EPD and the TPC have been normalized. (Not "normalized" so that their lengths are unity, but rather I divide out the sum of the weights. Everybody does this, but I make this note for Xiaoyu since I have not always been doing it.)if(Multiplicity <= 19) CentId = -1; // > 80%
else if (Multiplicity > 19 && Multiplicity <= 31) CentId = 0; // 70-80%
else if (Multiplicity > 31 && Multiplicity <= 46) CentId = 1; // 60-70%
else if (Multiplicity > 46 && Multiplicity <= 67) CentId = 2; // 50-60%
else if (Multiplicity > 67 && Multiplicity <= 93) CentId = 3; // 40-50%
else if (Multiplicity > 93 && Multiplicity <= 128) CentId = 4; // 30-40%
else if (Multiplicity > 128 && Multiplicity <= 172) CentId = 5; // 20-30%
else if (Multiplicity > 172 && Multiplicity <= 230) CentId = 6; // 10-20%
else if (Multiplicity > 230 && Multiplicity <= 267) CentId = 7; // 5-10%
else if (Multiplicity > 267) CentId = 8; // 0-5%
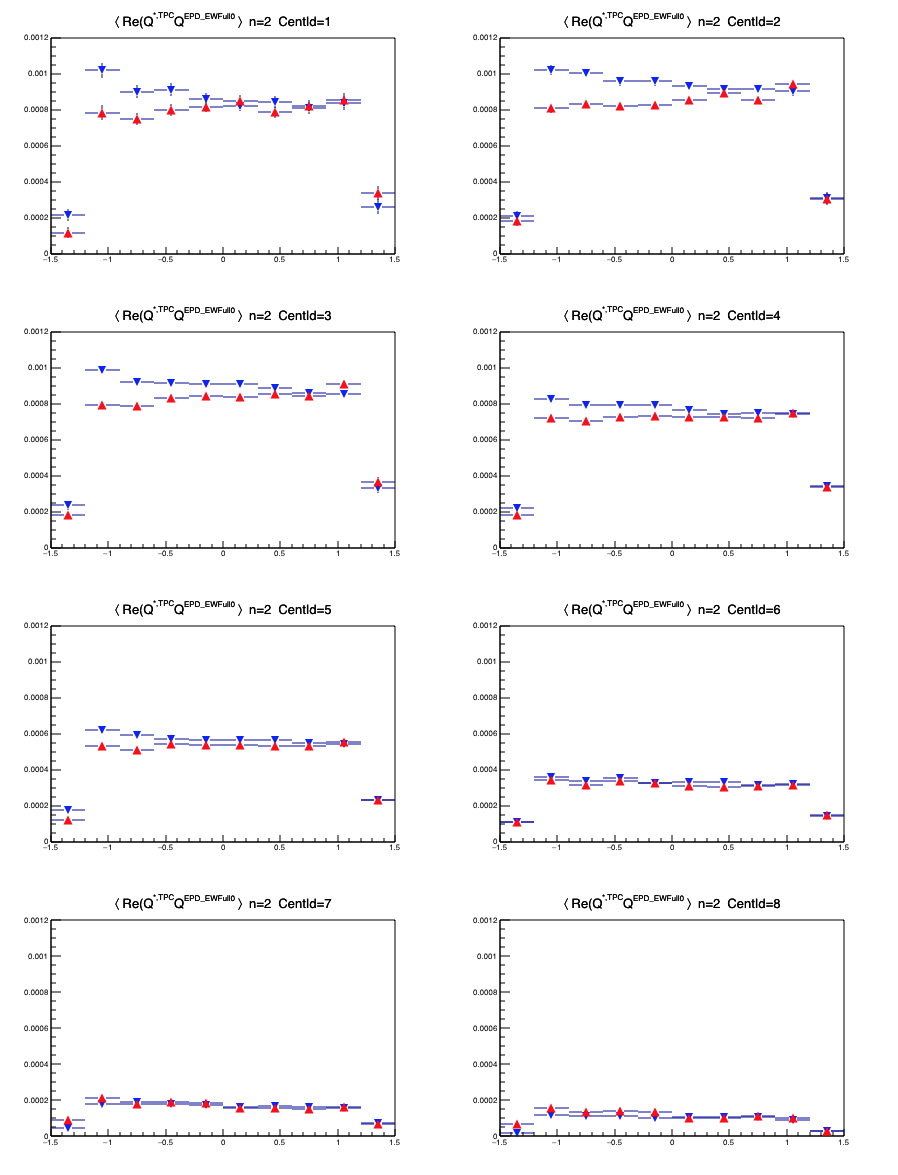
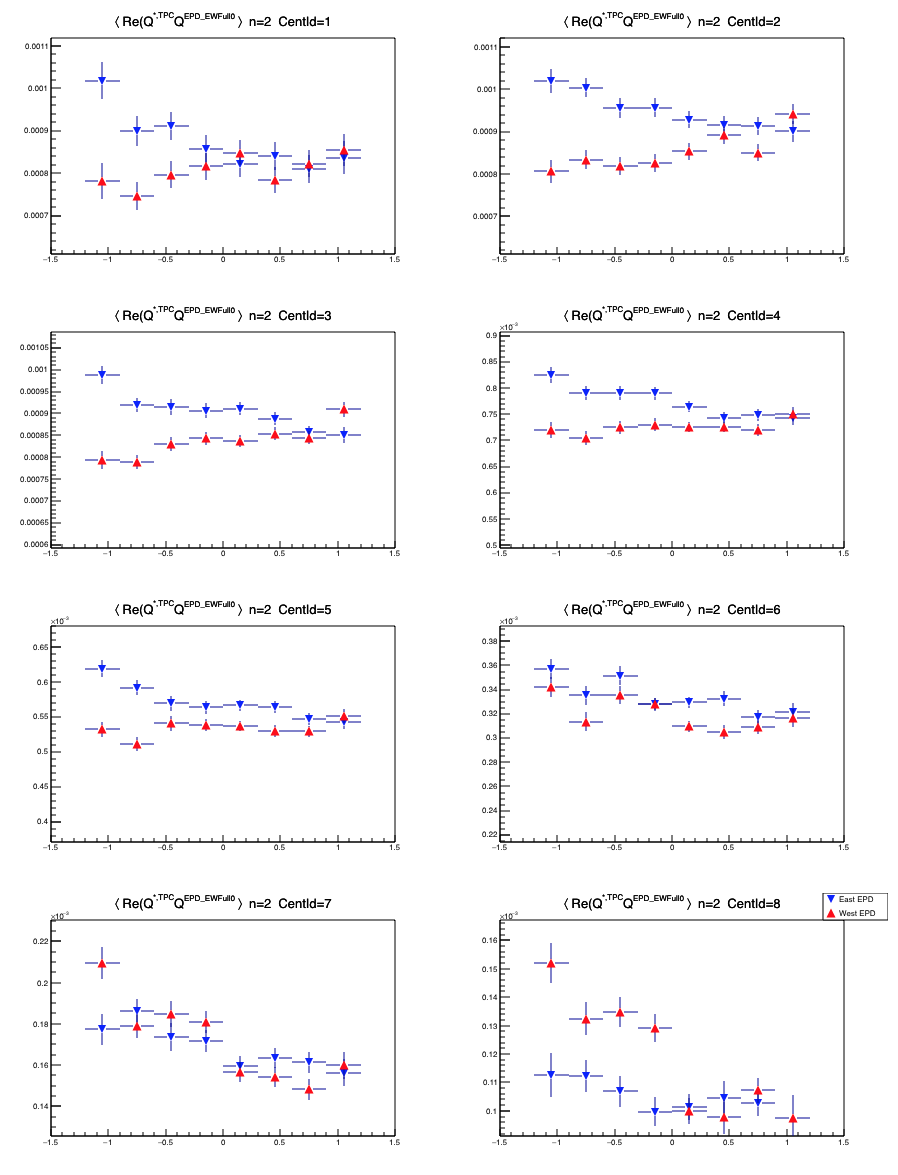
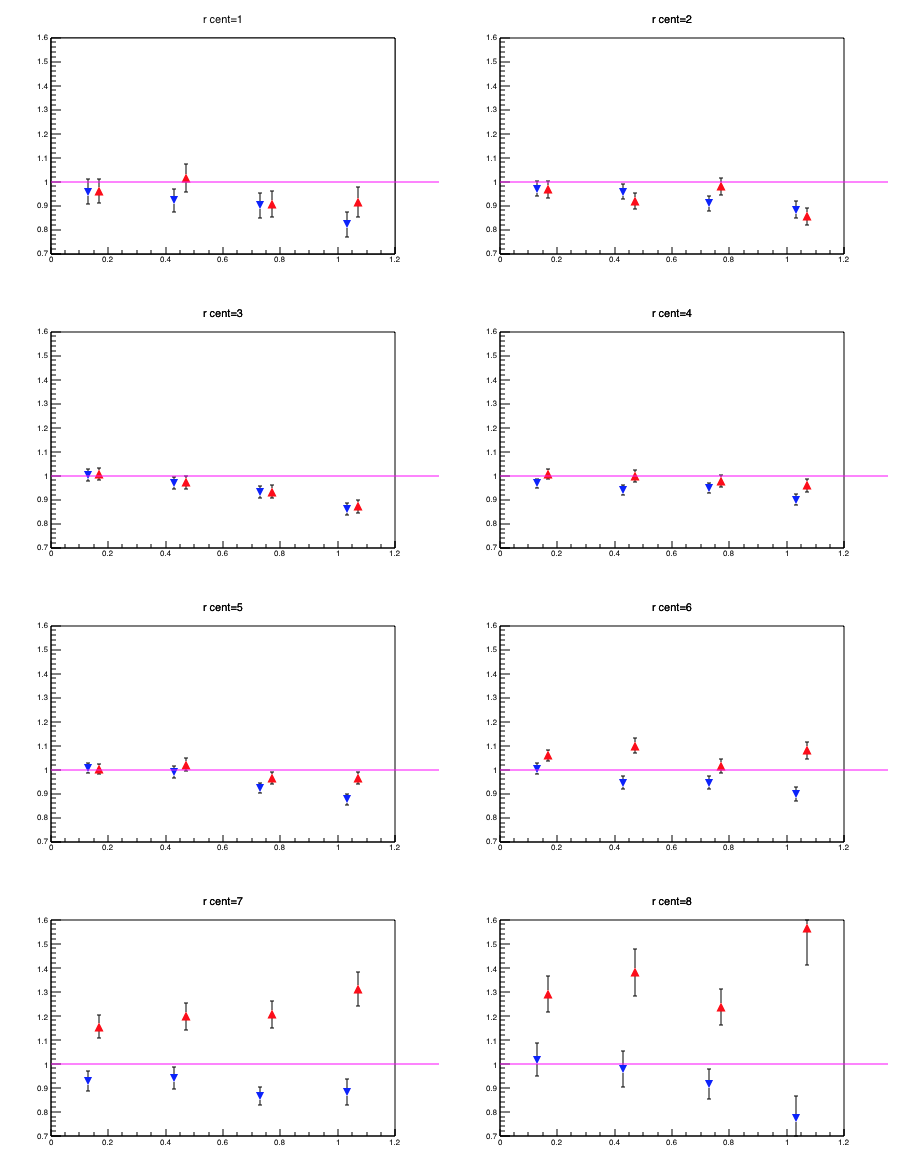
Here are three sets of images. Best if you set your screen so everything is side-by-side. Here, down blue triangles are East EPD and red up triangles are West EPD.
- Figure 1 (left two columns): <Q2TPC . Q2EPD> versus eta for eight centrality bins. The scale on the y-axis is fixed.
- Figure 2 (middle two columns): Same as figure 1, except blown up to focus on the the main TPC range.
- Figure 3 (right two columns): the ratio "r" as a function of |eta|. y-scale is again fixed.
I'm not sure what's going on, but a few things are clear:
- The scalar product goes down as collisions become more central. That's natural and expected.
- At least for the more central collisions, there is an obvious "jump" at eta=0. The scalar product on the East part of the TPC is higher than in the West part of the TPC. This is true no matter if we use East or West EPD.
- The EpdEast / EpdWest discrepancy in "r" is small for peripheral collisions and grows dramatically for the more central collisions. For the most central collisions there is a complete discrepancy and "r" is always >1 for EpdWest!!
- That might explain the particularly strong "uptick" of the scalar product for the most backward particles?
- That would enhance the apparent decorrelation using EpdEast and suppress the apparent decorrelation using EpdWest.
- It could also explain the dramatic effect in lower right panel of figure 3.
But why most noticeably for the more central collisions?
- Who knows. Flow dependence on pT and d2N/detadpT dependence on centrality is complicated.
- But maybe it's because for the more peripheral collisions, the flow and the flow decorrelation are simply stronger, and overpower the detector effect. For the more central collisions, the detector effect dominates weak flow and decorrelation.
A pT cut
To reduce effects of the single iTPC sector on the East side, I impose a requirement pT>0.2 GeV/c on the TPC tracks. For such a mild cut, I'd say the effect is significant. Below are the same figures as above, except with pT>0.2.
- Figure 4 (left two columns): <Q2TPC . Q2EPD> versus eta for eight centrality bins. The scale on the y-axis is fixed. TPC tracks have pT > 0.2 GeV/c.
- Figure 5 (middle two columns): Same as figure 1, except blown up to focus on the the main TPC range. TPC tracks have pT > 0.2 GeV/c.
- Figure 6 (right two columns): the ratio "r" as a function of |eta|. y-scale is again fixed. TPC tracks have pT > 0.2 GeV/c.
Now, putting the figures without pT cut next to the same figure with pT cut: (These are the same figures as above, but rearranged.)
Figures 7 and 8 are the same as figures 1 and 4 above. <Q2TPC . Q2EPD> versus eta for eight centrality bins. The scale on the y-axis is fixed. Left: no pT cut; Right: TPC tracks have pT > 0.2 GeV/c.
Figures 9 and 10 are the same as figures 2 and 5 above. <Q2TPC . Q2EPD> versus eta for eight centrality bins, with vertical autoscaled and blown up to focus on the the main TPC range. Left: no pT cut; Right: TPC tracks have pT > 0.2 GeV/c.
Figures 11 and 12 are the same as figures 3 and 6 above. the ratio "r" as a function of |eta|. vertical scale fixed. Left: no pT cut; Right: TPC tracks have pT > 0.2 GeV/c.
The effects of this quite mild pT cut are
- increase of the scalar product (compare figures 7 and 8). Makes sense since flow increases with pT in general
- increased agreement between the "r" using EastEpd and WestEpd. At this point, I'd say that they are completely consistent for centralities 1-5.
- The "r" using the WestEpd went down more than the "r" using the EastEpd went up. (I.e. the red points moved more than the blue ones, in figures 11 and 12.) I'm not sure whether to be surprised by this.
Stronger pT cut
Here are the results for setting the pT cut to 300 MeV rather than 200 MeV. It seems like there is a little bit more improvement. The rest of this study I leave to Xiaoyu.
»
- lisa's blog
- Login or register to post comments