Multi-MIP events in 2017 EPD Au+Au 54 GeV
Updated on Thu, 2017-06-15 16:46. Originally created by lisa on 2017-06-14 10:24.
Rosi kindly gave me some ADC distributions with a cut on non-zero TDC, for those tiles that have TDC, for the 54 GeV Au+Au data. I have been looking at them.
The EPD was segmented with a purpose to have about 10% (on average) double-hit probability at 19 GeV, but at 54 GeV, we have huge multi-hit rates. I would say it all looks very nice, but this makes the important point that we cannot do a hit/no-hit treatment, to get the dN/deta distribution. For lower energies it might work, but not here. (Also, it wouldn't make sense to do a "ADC weighting" approach.)
Rather, what must be done, for some centrality cut and narrow cut on Zvertex, is to fill the ADC distribution for each tile, do multi-MIP fits as I show here, and then we know what is the yield, per event, for that tile, for that Zvertex range. Kind of a pain, yes?
Now then, the method TVector3 StEpdTile::RandomPointOnTile() is so so convenient, for making a dN/deta distribution, if one does a hit/no-hit analysis. With this large multi-hit rate, we have to do something more sophisticated and we should talk about it.
Some ADC distributions and fits to them
I have before posted many many fits to ADC spectra, that include multiple convoluted Landau distributions, further convoluted with Poisson statistics and further convoluted with Gaussian transfer function to ADC. The upshot of those studies (and more that I have done since then), is that the width of a N-MIP distribution is greatly dominated by Landau fluctuations; finite photon statistics make a very small perturbation. That fact, together with the fact that I am really only interested in extracting the number of 1-hit, 2-hit, N-hit events, leads me to ignore the small effects of Poisson broadening and allow that to be absorbed into a slightly too-large WID parameter in the Landau distribution.
The fits are thus VERY SIMPLE. The TWO parameters are
1) The MPV of the single-MIP peak. (This is something you basically see with your eyeball and depends on the gain of the SiPM+FEE+ADC.)
2) The WID/MPV of the single-MIP peak. For 1.2 cm scintillator, it is known to be about 0.13, as found in the literature. I allow it to vary like 10% in the fits. It is very constrained.
And that's it. Once you have the one-MIP Landau parameters, the multi-MIP distributions are totally determined by convolution. No further parameters.
So, the only other parameters are the number of N-MIP events, which is precisely what we are interested in.
The fits I am showing here are much much simpler than the ones I've shown previously (because my task is simpler).
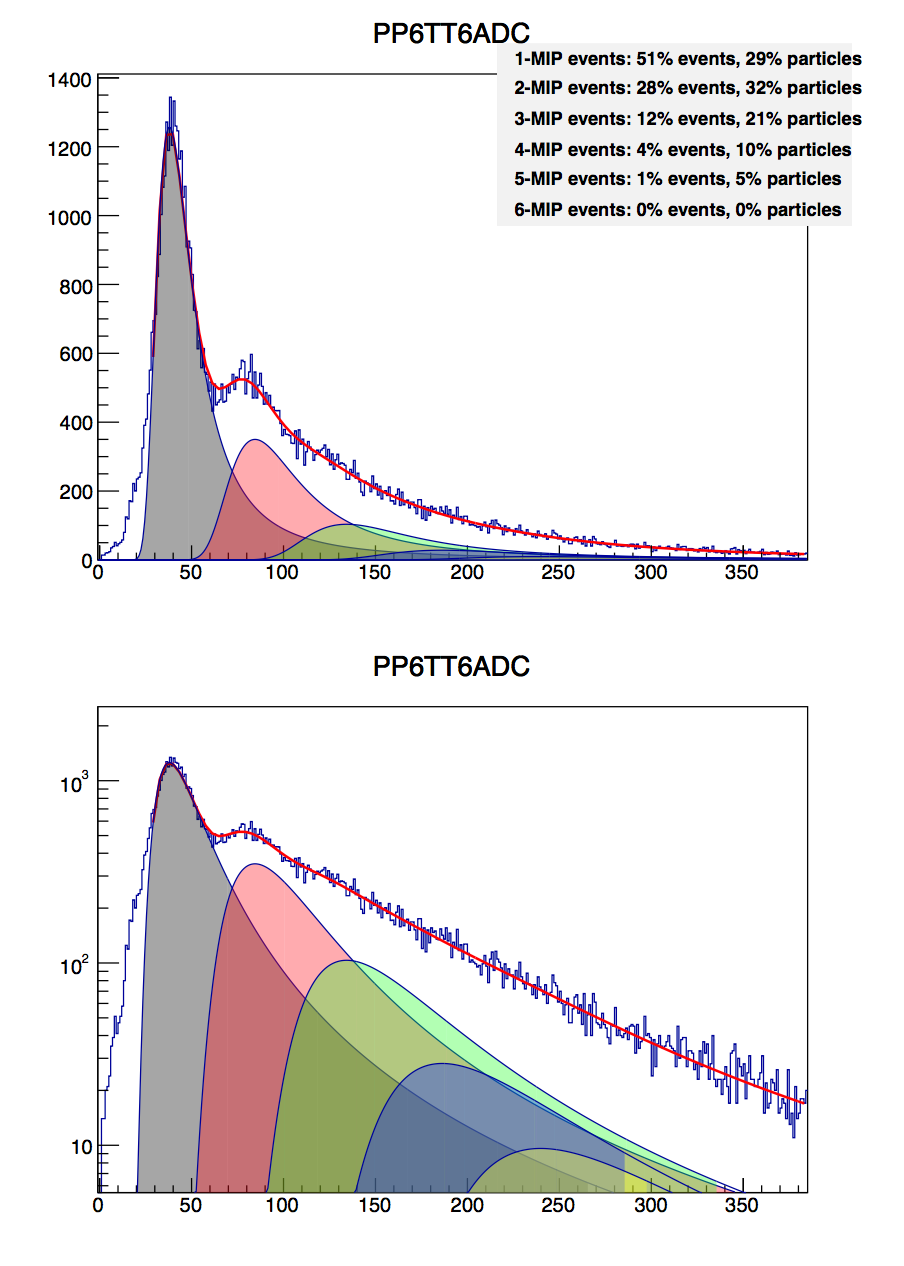
Here are shown three examples from different parts of the EPD. Note that the multiple-hit rates are NOT limited only to the small-radius tiles. We are getting blasted here! (Furthermore, these are minbias I think. Central events will be even more interesting!) The same distribution is plotted twice, once log and once linear.

.png)
You may find fits to all tiles in the pdf files attached at the bottom of this page. Some notes:
A comforting and important note: On 30 May 2017, I had done a very simple analysis based on our geometry, Poisson statistics and the PHOBOS published dN/deta distributions at 62.4 GeV central collisions. You can find it here:
drupal.star.bnl.gov/STAR/subsys/epd/operations-2017/53-gev-run
There, in fact, the expectation was that all tiles will see similar multi-MIP event rates, consistent with what we see.
In the minimum-bias analysis I've done here, single-MIP events make up about 40-60% of the events. The PHOBOS-based study tells us that for central collisions, this will drop to more like 35%, for collisions occurring at the center of the TPC. It is nice to see that these expectations seem to be consistent with what we see.
Multi-hit rates and the fact that we cannot treat the EPD as a hit/no-hit detector at these energies
The EPD was segmented with a purpose to have about 10% (on average) double-hit probability at 19 GeV, but at 54 GeV, we have huge multi-hit rates. I would say it all looks very nice, but this makes the important point that we cannot do a hit/no-hit treatment, to get the dN/deta distribution. For lower energies it might work, but not here. (Also, it wouldn't make sense to do a "ADC weighting" approach.)
Rather, what must be done, for some centrality cut and narrow cut on Zvertex, is to fill the ADC distribution for each tile, do multi-MIP fits as I show here, and then we know what is the yield, per event, for that tile, for that Zvertex range. Kind of a pain, yes?
Now then, the method TVector3 StEpdTile::RandomPointOnTile() is so so convenient, for making a dN/deta distribution, if one does a hit/no-hit analysis. With this large multi-hit rate, we have to do something more sophisticated and we should talk about it.
Some ADC distributions and fits to them
I have before posted many many fits to ADC spectra, that include multiple convoluted Landau distributions, further convoluted with Poisson statistics and further convoluted with Gaussian transfer function to ADC. The upshot of those studies (and more that I have done since then), is that the width of a N-MIP distribution is greatly dominated by Landau fluctuations; finite photon statistics make a very small perturbation. That fact, together with the fact that I am really only interested in extracting the number of 1-hit, 2-hit, N-hit events, leads me to ignore the small effects of Poisson broadening and allow that to be absorbed into a slightly too-large WID parameter in the Landau distribution.
The fits are thus VERY SIMPLE. The TWO parameters are
1) The MPV of the single-MIP peak. (This is something you basically see with your eyeball and depends on the gain of the SiPM+FEE+ADC.)
2) The WID/MPV of the single-MIP peak. For 1.2 cm scintillator, it is known to be about 0.13, as found in the literature. I allow it to vary like 10% in the fits. It is very constrained.
And that's it. Once you have the one-MIP Landau parameters, the multi-MIP distributions are totally determined by convolution. No further parameters.
So, the only other parameters are the number of N-MIP events, which is precisely what we are interested in.
The fits I am showing here are much much simpler than the ones I've shown previously (because my task is simpler).
Here are shown three examples from different parts of the EPD. Note that the multiple-hit rates are NOT limited only to the small-radius tiles. We are getting blasted here! (Furthermore, these are minbias I think. Central events will be even more interesting!) The same distribution is plotted twice, once log and once linear.
You may find fits to all tiles in the pdf files attached at the bottom of this page. Some notes:
- Some spectra were not provided as the TDC was not working
- Some spectra are poorly fit as the automated procedure I did here went off the rails. For most cases this could be easily remedied.
- A few spectra-- even those that have a TDC-- look just strange. We are still discussing these.
- There is always some yield to the low-ADC side of the peak that is not accounted for. I have discussed this previously, and I think this will contribute to our systematic error. It shouldn't be too bad.
- I have also attached the macro that does these fits, at the bottom. Because drupal won't allow files that end in ".C", I have appended the fake extension ".txt".
- Only about half of the events in a tile (and remember, these (I think) are minbias events!) are single-MIP events. These single-MIP events contribute about 30% of the particles that actually passed through the detector.
- If we do a hit/no-hit analysis, we will underestimate the yield by factors on order of 2. And the degree of underestimation varies with eta. So we would get the wrong magnitude and to some degree the wrong shape of dN/deta.
A comforting and important note: On 30 May 2017, I had done a very simple analysis based on our geometry, Poisson statistics and the PHOBOS published dN/deta distributions at 62.4 GeV central collisions. You can find it here:
drupal.star.bnl.gov/STAR/subsys/epd/operations-2017/53-gev-run
There, in fact, the expectation was that all tiles will see similar multi-MIP event rates, consistent with what we see.
In the minimum-bias analysis I've done here, single-MIP events make up about 40-60% of the events. The PHOBOS-based study tells us that for central collisions, this will drop to more like 35%, for collisions occurring at the center of the TPC. It is nice to see that these expectations seem to be consistent with what we see.
»
- lisa's blog
- Login or register to post comments