Phi distributions not understood - isobar runs
Updated on Wed, 2019-01-16 11:45. Originally created by lisa on 2019-01-11 17:45.
Note: The questions raised on this page were sent to starsoft on 12 Jan 2019. You can see the discussion in the response(s) to this mail: www.star.bnl.gov/HyperNews-star/protected/get/starsoft/10300.html
Xiaoyu Liu has been looking at eta-phi distributions from isobar running (mixed RuRu and ZrZr). We see an efficiency "hole" in phi on the East side, presumably due to the iTPC. However, we are surprised to see so many high pT tracks lost, and would appreciate any input.
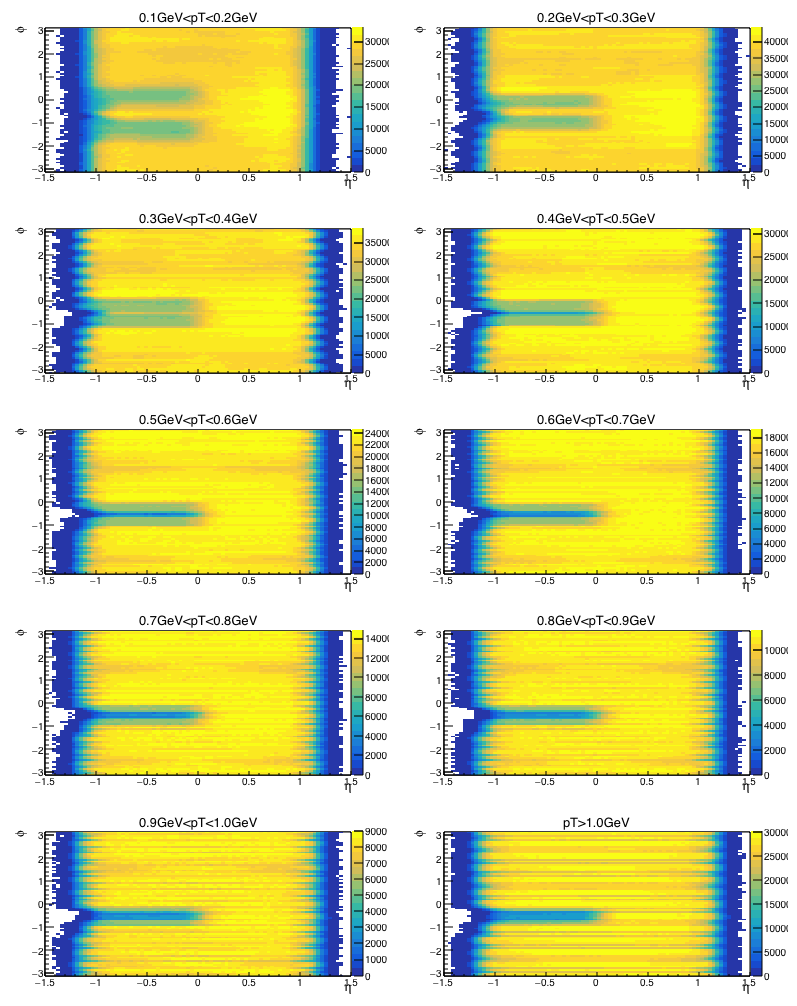
Figure 1 - Raw yields as a function of angle (eta and phi), for different pT cuts. We see the "hole" on the East side (i.e. for eta<0).
Much of what we see in figure 1 makes sense, if we keep in mind that both (+) and (-) charged tracks are used to make these plots. Here are some drawings to explain:
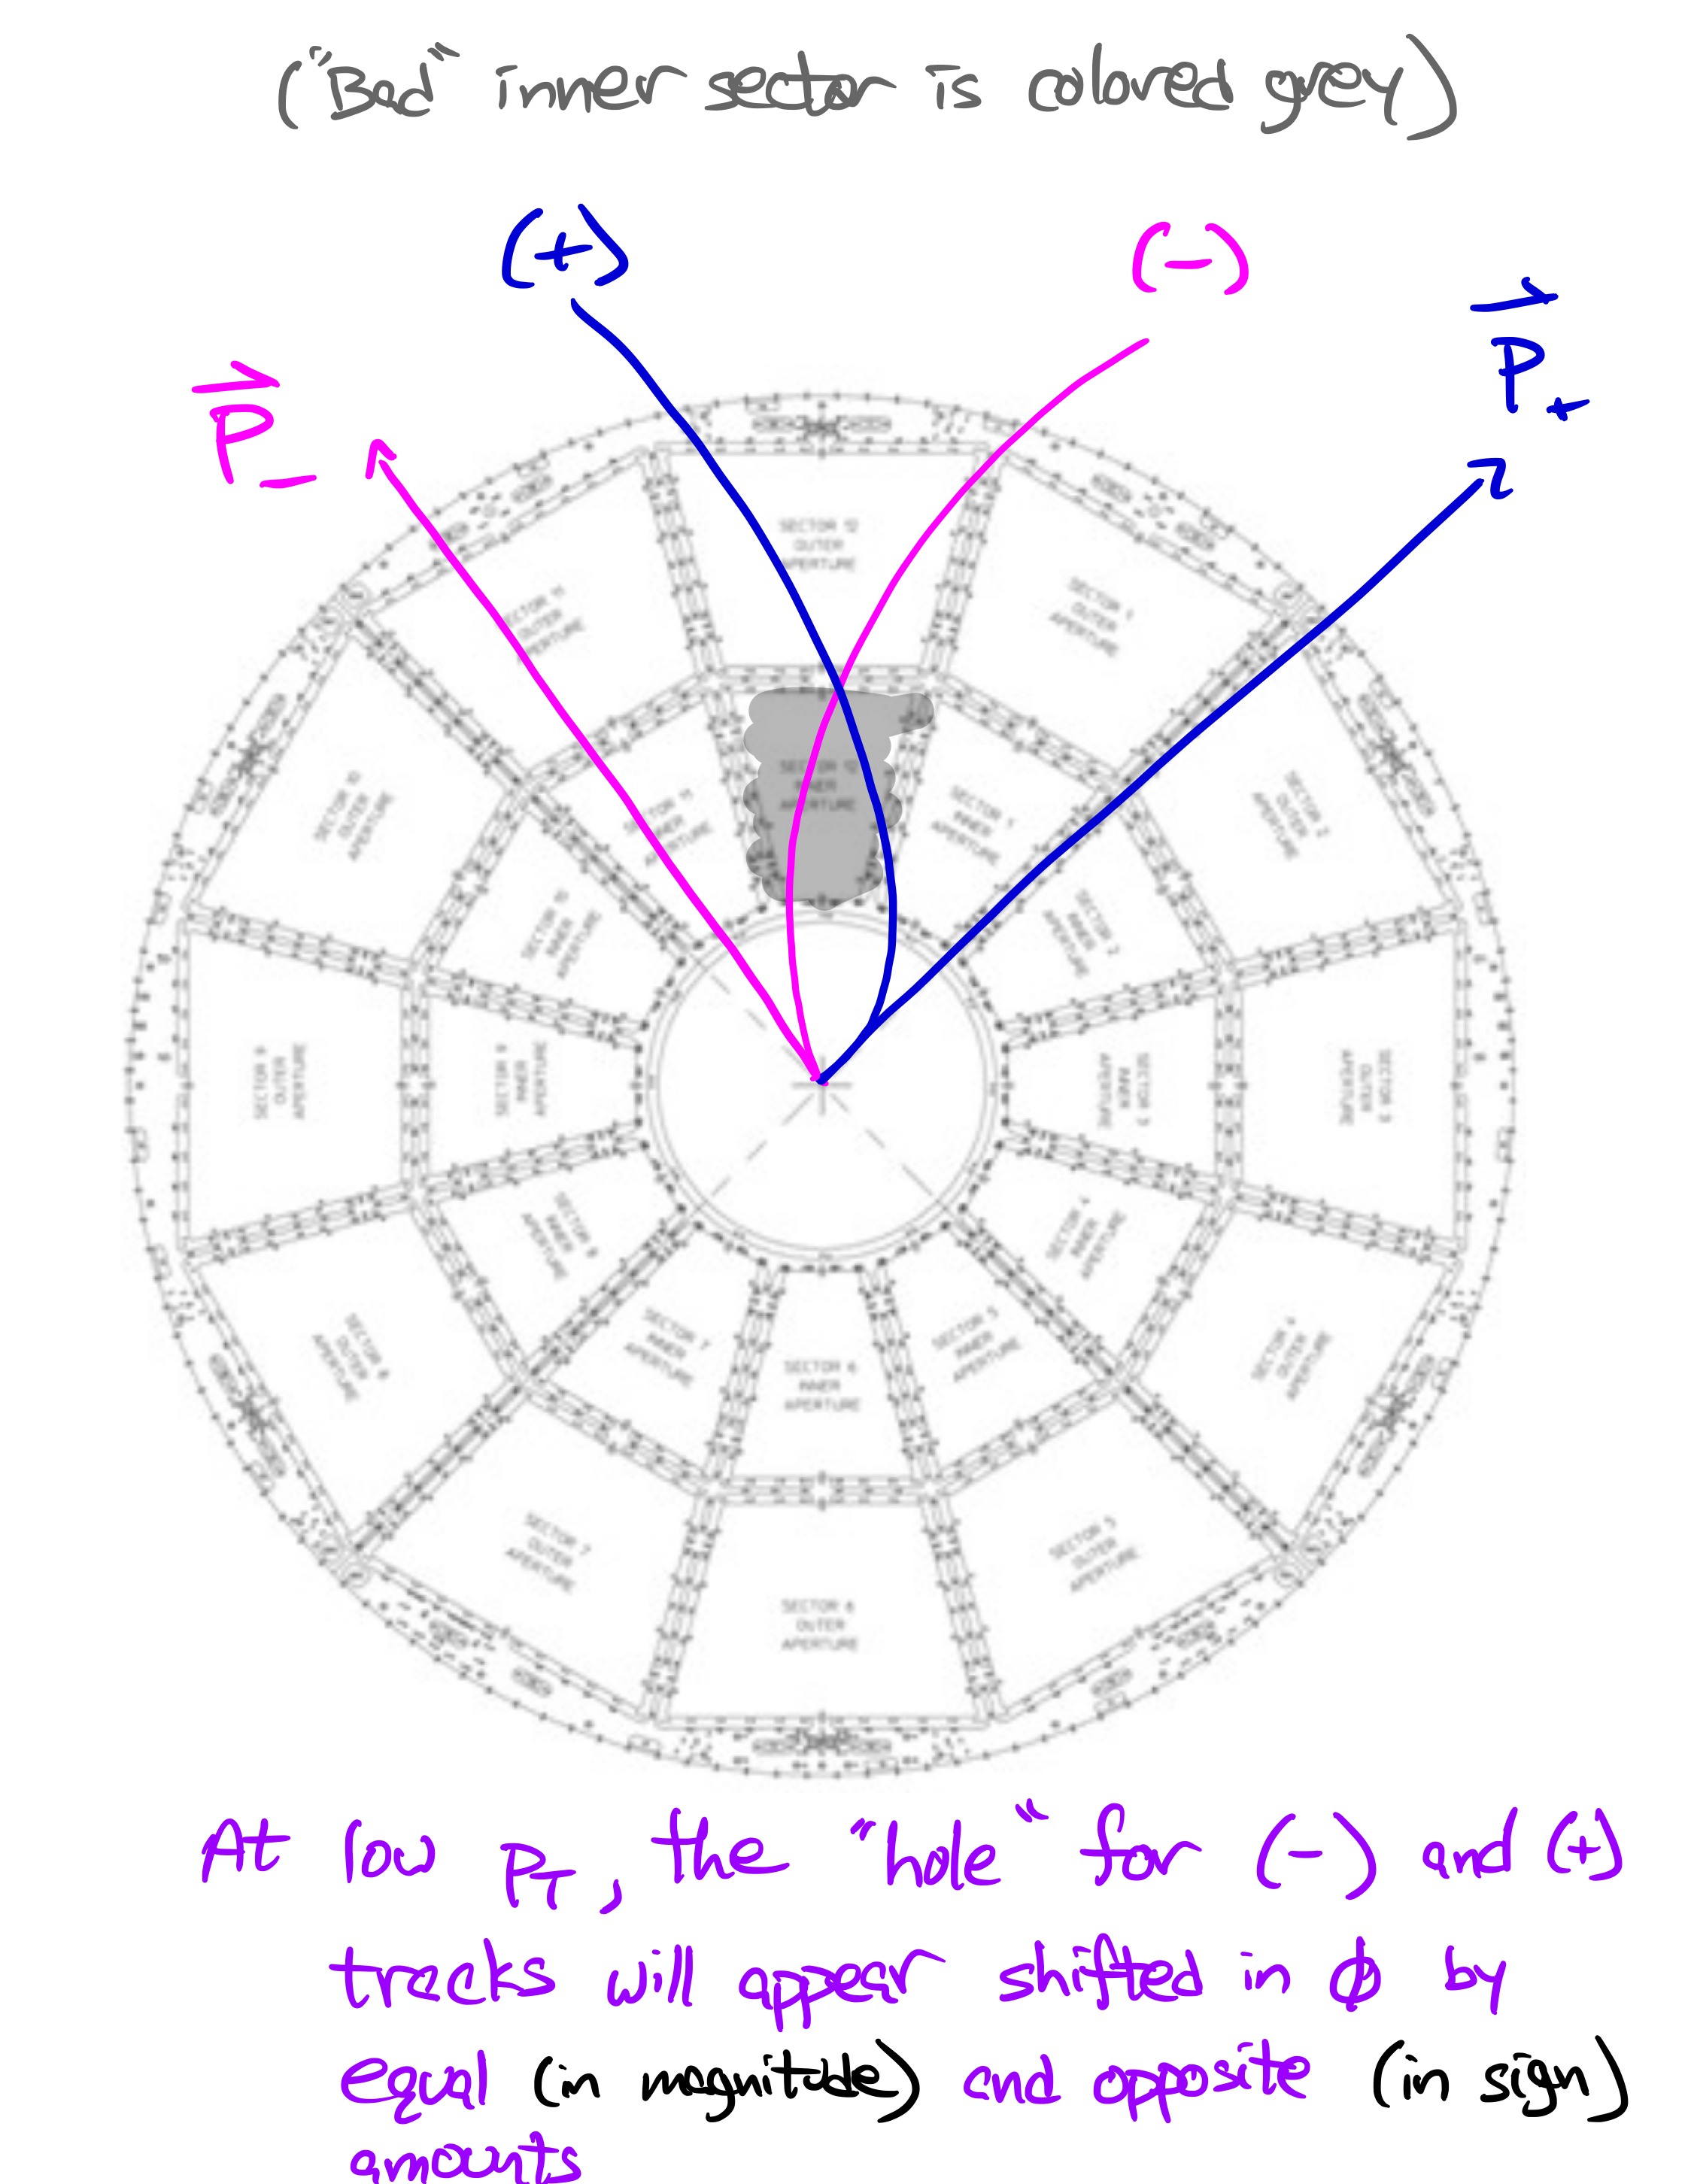
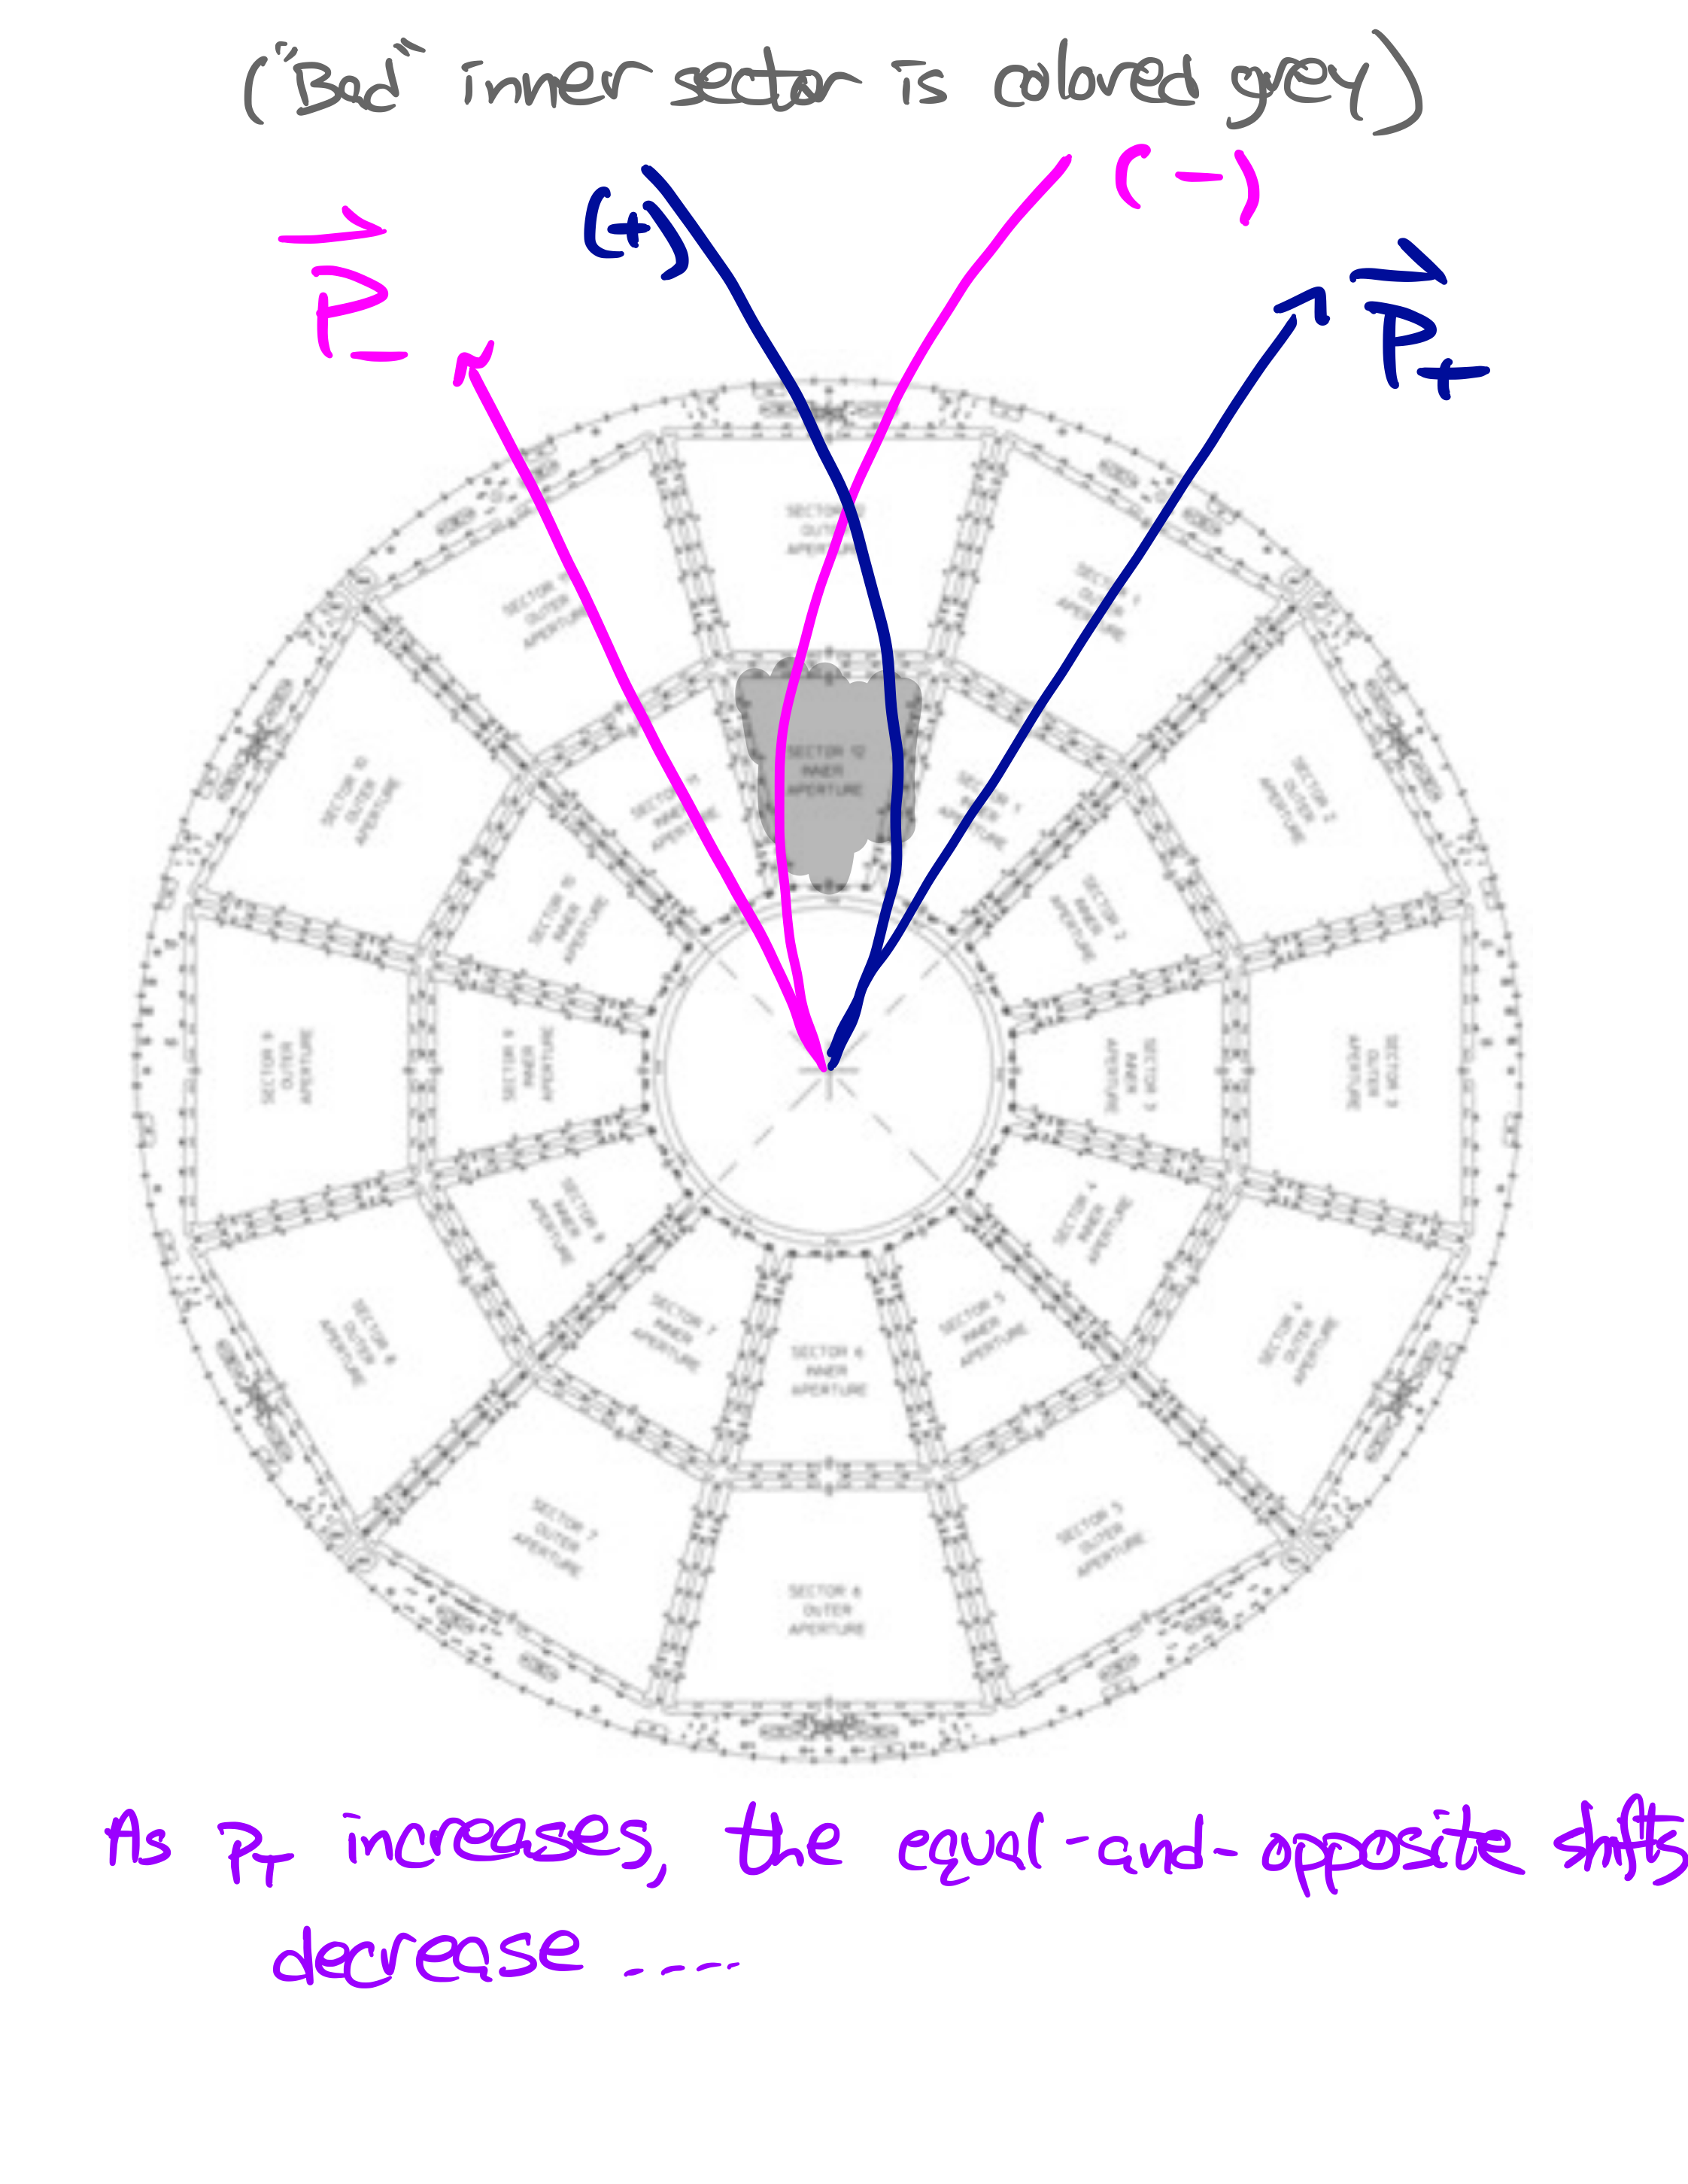
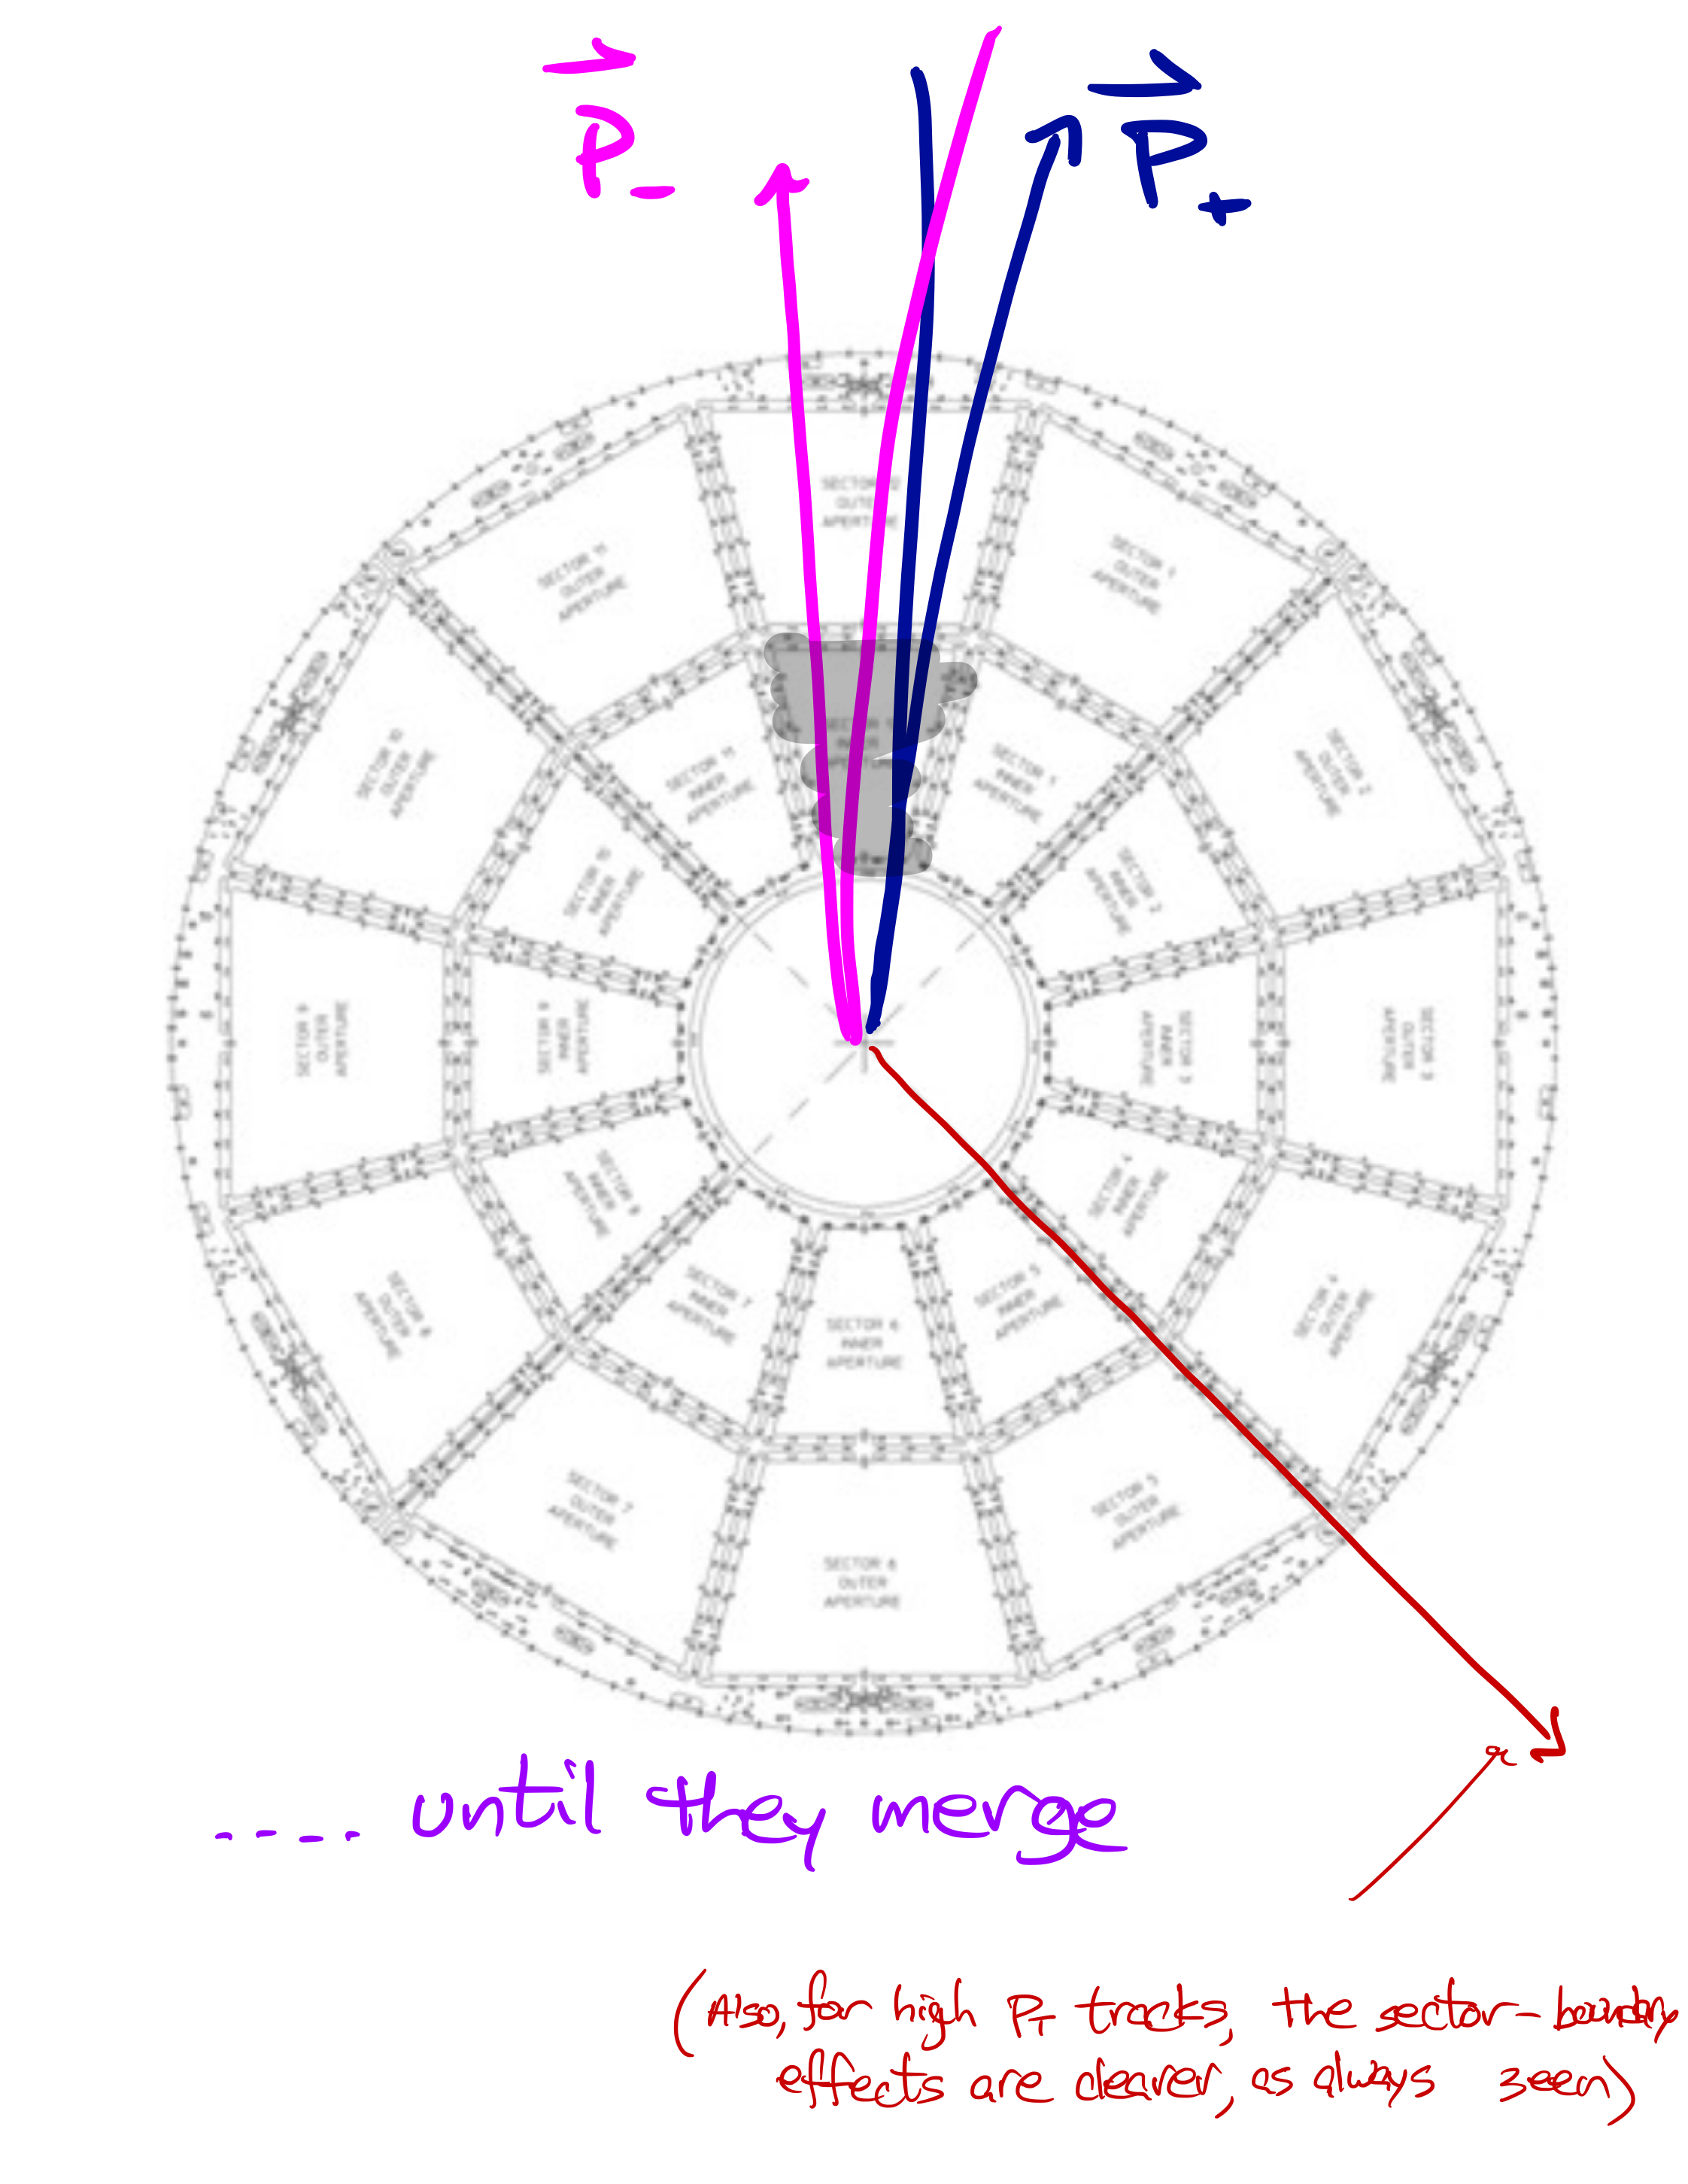
Figures 2-4: Just some cartoons explaining the gross features seen in Figure 1.
BUT.... why is the hole equally strong for both low and high pT tracks? I would think that low pT tracks would be affected most, as they can lose a lot of hits in one inner sector and become un-trackable. Pattern-recognizing a very curved track requires many hits. But the very high pT tracks will be straight and will not rely so much on the inner sector.
In fact, at high pT, we are losing fully 75% of the tracks, in a broad phi region. Any ideas why this would be?
Here are some 1D projections, in phi, just for the East side:
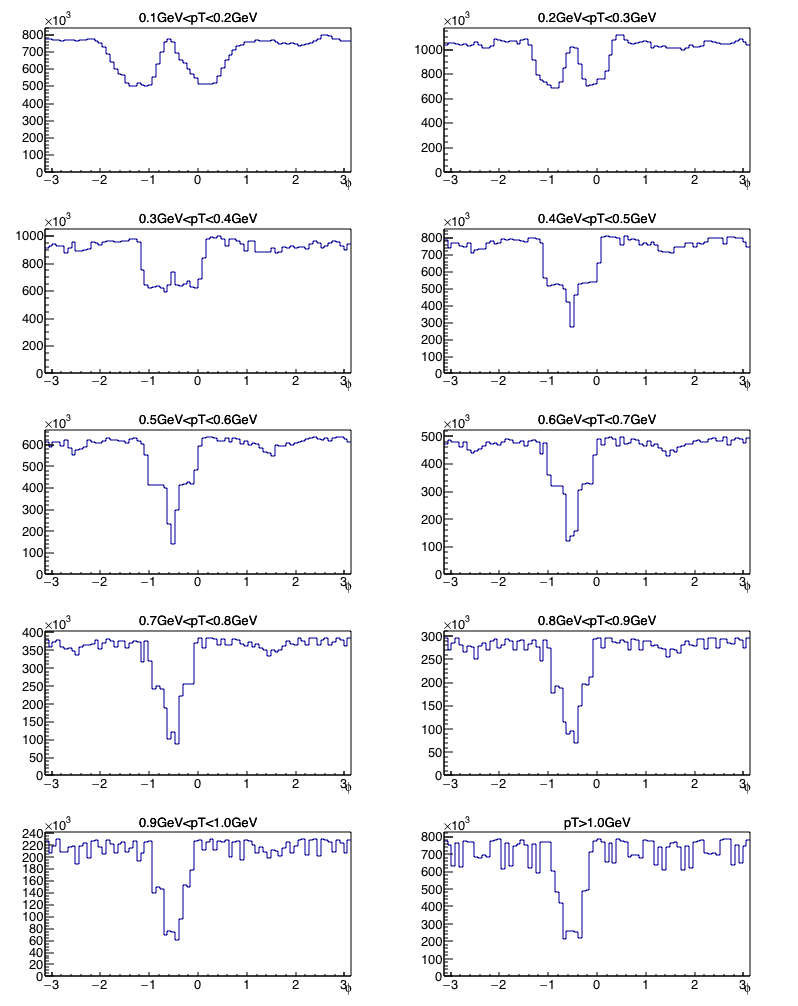
Figure 5: Phi distributions, for different cuts in pT, for particles traveling to the East (eta<0).
Any insights would be appreciated.
Note: The questions raised on this page were sent to starsoft on 12 Jan 2019. You can see the discussion in the response(s) to this mail: www.star.bnl.gov/HyperNews-star/protected/get/starsoft/10300.html
Xiaoyu Liu has been looking at eta-phi distributions from isobar running (mixed RuRu and ZrZr). We see an efficiency "hole" in phi on the East side, presumably due to the iTPC. However, we are surprised to see so many high pT tracks lost, and would appreciate any input.
Figure 1 - Raw yields as a function of angle (eta and phi), for different pT cuts. We see the "hole" on the East side (i.e. for eta<0).
Much of what we see in figure 1 makes sense, if we keep in mind that both (+) and (-) charged tracks are used to make these plots. Here are some drawings to explain:
Figures 2-4: Just some cartoons explaining the gross features seen in Figure 1.
BUT.... why is the hole equally strong for both low and high pT tracks? I would think that low pT tracks would be affected most, as they can lose a lot of hits in one inner sector and become un-trackable. Pattern-recognizing a very curved track requires many hits. But the very high pT tracks will be straight and will not rely so much on the inner sector.
In fact, at high pT, we are losing fully 75% of the tracks, in a broad phi region. Any ideas why this would be?
Here are some 1D projections, in phi, just for the East side:
Figure 5: Phi distributions, for different cuts in pT, for particles traveling to the East (eta<0).
Any insights would be appreciated.
»
- lisa's blog
- Login or register to post comments