Suggestion: Pictograph of tile problem history
Updated on Thu, 2020-05-21 12:10. Originally created by lisa on 2020-05-21 11:48.
Before raw data is produced into STAR DST/muDst/picoDst files, the EPD signals have to be gain-calibrated. This involves producing ADC distributions and fitting with Landaus to identify single-MIP MPV. In this process, one also identifies various problems-- "spikes," displaced pedestals, "dead," "noisy" etc. Some of these are severe enough to identify the tile as unusable-- "bad"-- for physics analysis.
Even a given tile may have problems for some runs but not others. (E.g. displaced pedestal can be rectified if the shift crew takes a new pedestal run.) So, summarizing EPD problems can result in a cumbersome and overwhelming list. We do have ~100 runs during a campaign, and 744 EPD tiles, after all.
Here, I am suggesting some "pictographs" to indicate the types and frequency of problems, as well as hopefully some helpful patterns. (Note, I suppose these are not actually pictographs, but I like that word, so there.)
Two sets of pictographs should be produced for a given dataset (e.g. 2019 Au+Au at 19.6 GeV). They are just 2D histograms.
Here is an example, where obviously I have randomly sprinkled the problems throughout.
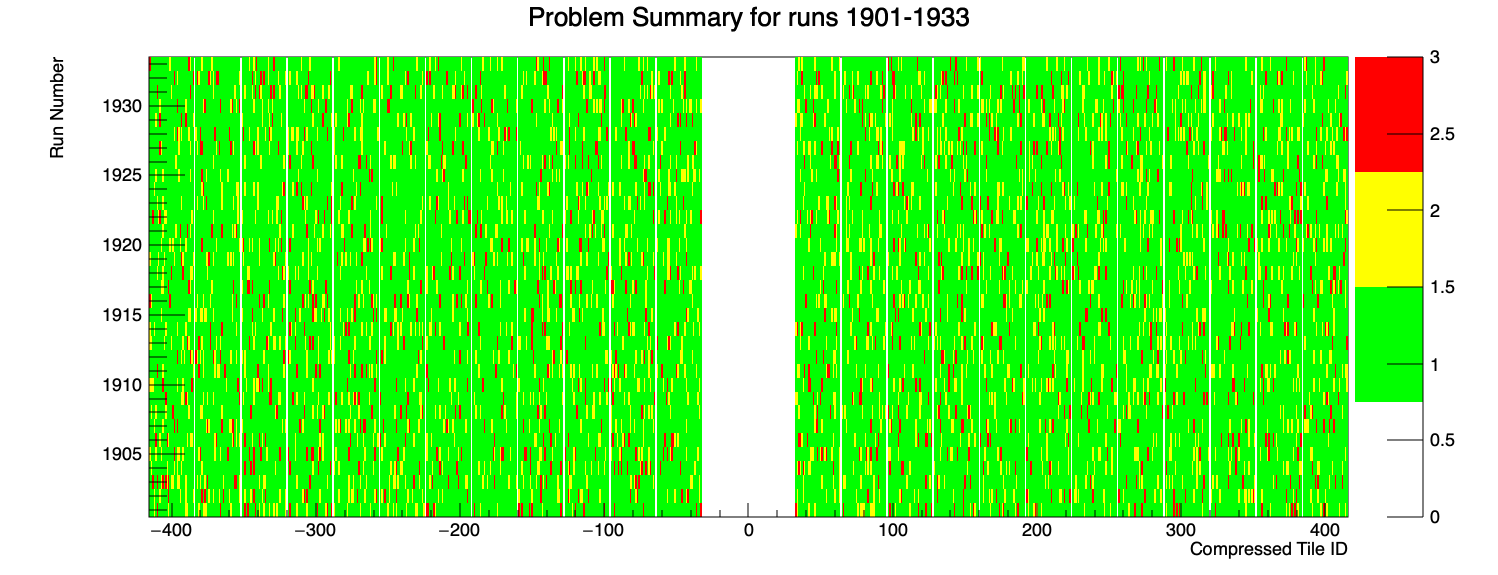
Figure 1 - Location-based pictograph. Here, "Compressed Tile ID" = (sign)*(PP*32+TT), where sign = -1 for East and +1 for West.
.png)
Figure 2 - Electronics-based pictograph. Here, "Compressed SlotChannel ID" = Slot*32+Channel. You need one histogram for each of the three EQ crates.
Attached to the bottom of this page is the macro I used to make these example pictographs. (Or just click here).
Introduction and goal
Before raw data is produced into STAR DST/muDst/picoDst files, the EPD signals have to be gain-calibrated. This involves producing ADC distributions and fitting with Landaus to identify single-MIP MPV. In this process, one also identifies various problems-- "spikes," displaced pedestals, "dead," "noisy" etc. Some of these are severe enough to identify the tile as unusable-- "bad"-- for physics analysis.
Even a given tile may have problems for some runs but not others. (E.g. displaced pedestal can be rectified if the shift crew takes a new pedestal run.) So, summarizing EPD problems can result in a cumbersome and overwhelming list. We do have ~100 runs during a campaign, and 744 EPD tiles, after all.
Here, I am suggesting some "pictographs" to indicate the types and frequency of problems, as well as hopefully some helpful patterns. (Note, I suppose these are not actually pictographs, but I like that word, so there.)
The Pictographs - details
Two sets of pictographs should be produced for a given dataset (e.g. 2019 Au+Au at 19.6 GeV). They are just 2D histograms.
- x-axis is a channel or tile identifier.
- y-axis is the run number.
- z-value, shown as colors, represents the problem. Skipper and the calibration crew have found that problems can be grouped into a handful of categories. In my pictographs, each problem has a color. Say "displaced pedestal" is yellow and "spikes" is red. In the pictographs below, green "means no problem."
Here is an example, where obviously I have randomly sprinkled the problems throughout.
Figure 1 - Location-based pictograph. Here, "Compressed Tile ID" = (sign)*(PP*32+TT), where sign = -1 for East and +1 for West.
Figure 2 - Electronics-based pictograph. Here, "Compressed SlotChannel ID" = Slot*32+Channel. You need one histogram for each of the three EQ crates.
Attached to the bottom of this page is the macro I used to make these example pictographs. (Or just click here).
»
- lisa's blog
- Login or register to post comments