BBC hits when EPD tiles see nothing - part 1
In this page, I studied the EPD hits when BBC tiles see nothing. In this post, I made the analysis in a reverse way, i.e looking at BBC hits when EPD tiles see nothing. In the previous study, we saw a tenfold compression of EPD hits when a certain BBC PMT doesn't fire. Since BBC stands behind EPD, we expected to see a larger compression when looking at BBC hits with EPD tiles not firing. However, from the plots that will be shown shortly, the compression is only around a factor of 3.4(east) and 4(west).
For convenience, I studied the ring one of the BBC detector since the tile numbers(1-6) are the same as the PMT numbers(1-6) on the ring one. Figure 1 shows a picture of both EPD and BBC tiles. Note that the way in which two detectors overlap with each other are exactly the same on the east and west side.
.png)
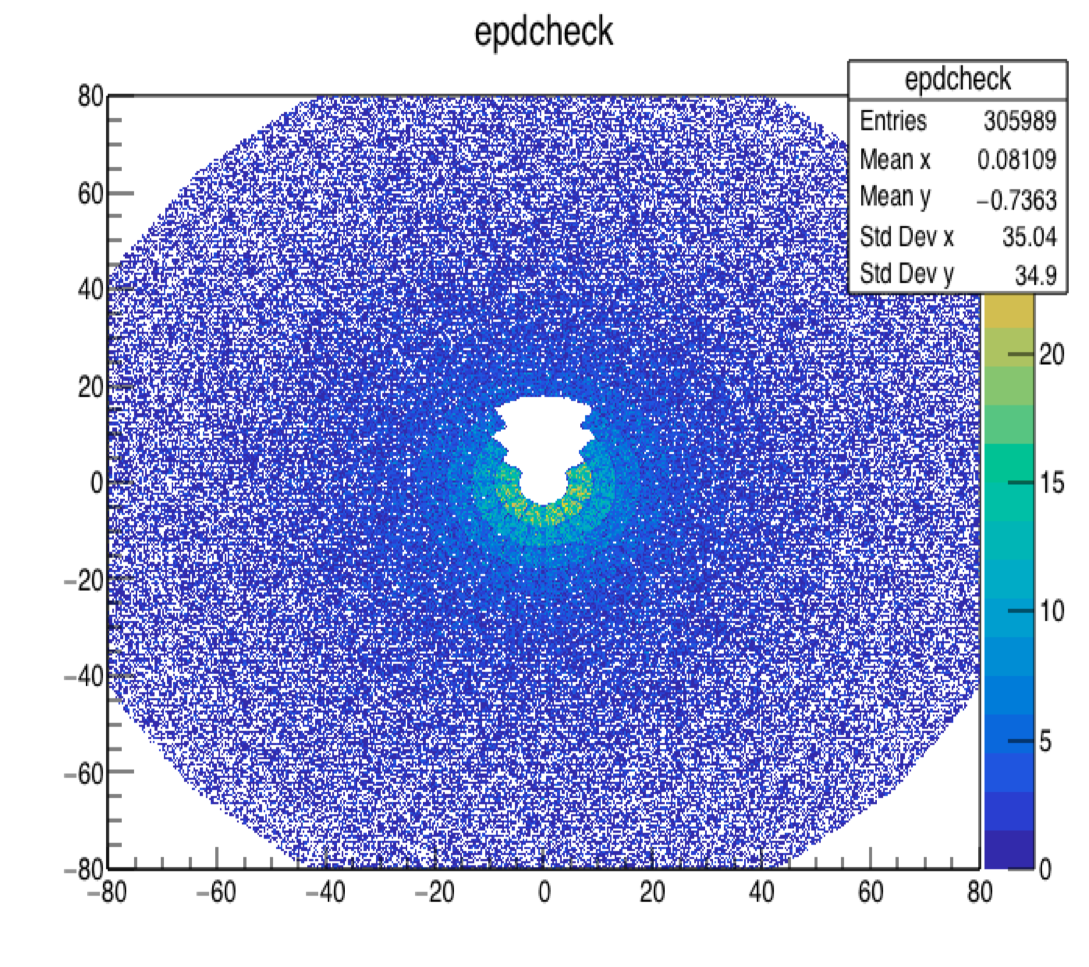
Figure 1 BBC and EPD tiles on the east side. Figure 2 EPD hits of the selected events
Here I looked at the BBC hits when the EPD tiles that cover BBC tile one don't fire. For safe, even the tiles that might slightly overlap with the BBC tile one were included. As shown on the above picture, the included tiles are (pp,tt): (11,1),(12,1),(1,1),(2,1),(11,2),(12,3),(12,2),(1,3),(1,2),(2,3),(12,5),(12,4),(1,5),(1,4). In this study, an EPD tile was regarded as 'unfired' when nMip<0.1, and a BBC 'hit' corresponds to the hit with ADC>150. Figure 2 demonstrates the EPD hits of the selected events.
For this study, I only used AuAu data.
.png)
.png)
Figure 3 left: BBC hits on the BBC Ring one (EAST); right: BBC hits on the BBC Ring one (WEST).
As shown on the above plot, the compression is only about a factor of 3.44 on the east and 4.06 on the west. Figure 4 shows the ADC distribution for each tile on the BBC Ring one. Figure 5 shows TAC VS ADC plots, and we can tell from it that the low compression is not due to the out of time signals.
.png)
Figure 4a ADC distributions for BBC tile 1 to 6 (EAST)
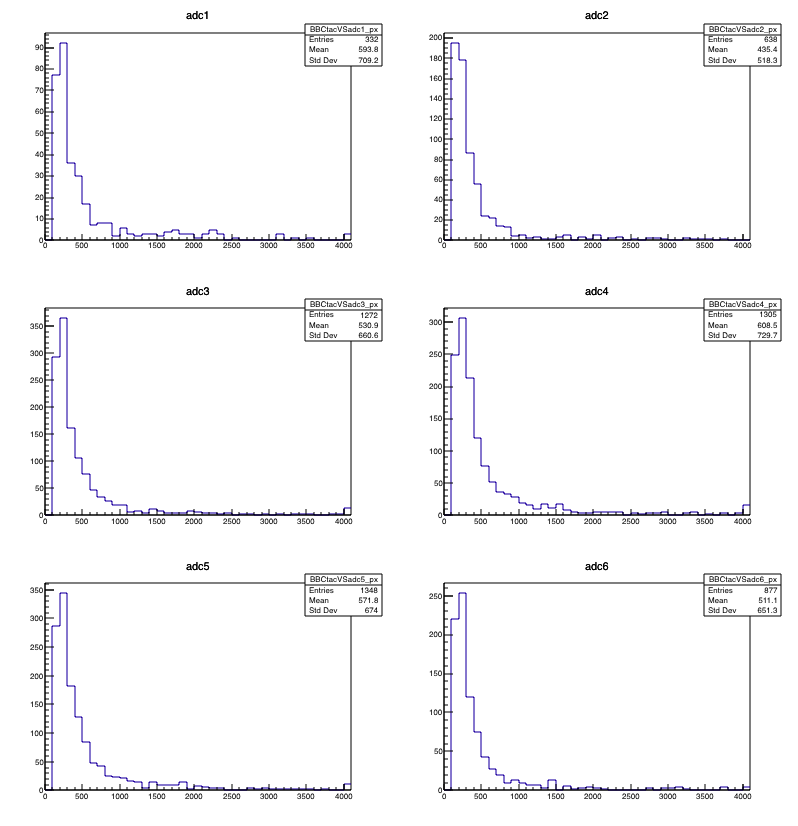
Figure 4b ADC distributions for BBC tile 1 to 6 (WEST)
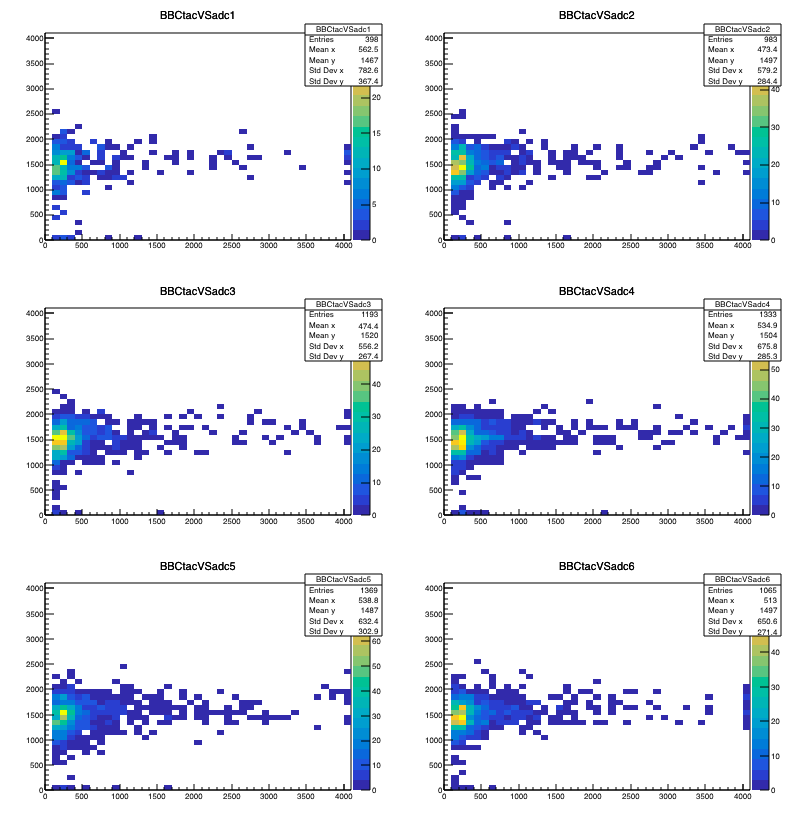
Figure 5a TAC vs ADC plots for BBC tile 1 to 6 (EAST), the y axis is the TAC and the x axis is the ADC signals. Compared with other tiles, tile one doesn't have more out of time signals. So the small compression is not due to the out of time signals.
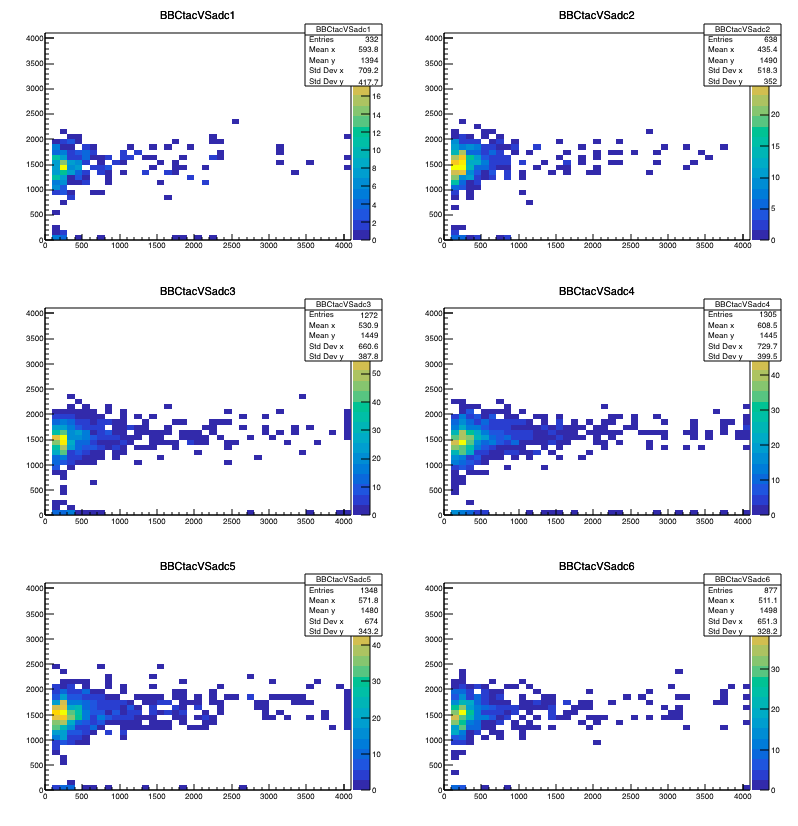
Figure 5a TAC vs ADC plots for BBC tile 1 to 6 (WEST)
- lxy1122's blog
- Login or register to post comments