Dark Current
Prashanth showed the dark current plots measured at 56.2V until April 30th here.
In this study, the data collected at 56.2V during the IV scan until May 16th was used. I selected 10 EPD tiles with highest dark current on the last day (May 16th) and this is the dark current vs time plot.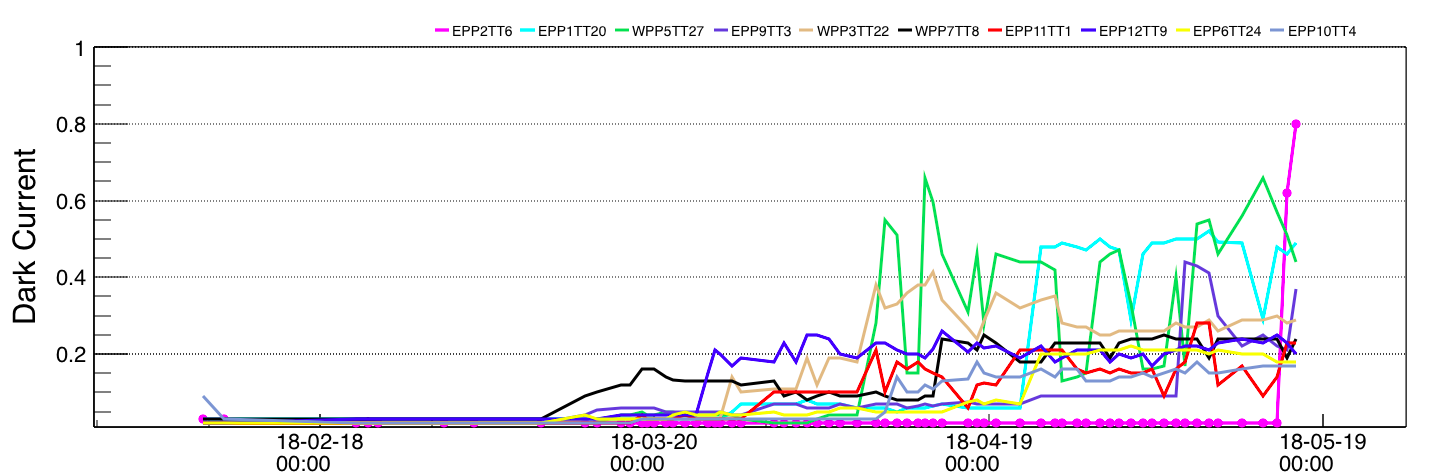
One of the useful information we can get from the above plot is that the tile EPP2TT6 was damaged on May 15th.
Mike focused on five tiles in this study and here is the dark current vs time plot for those five EPD tiles. Note that the tile WPP5TT27 shows up in both plots but is denoted by different colors(green and black).
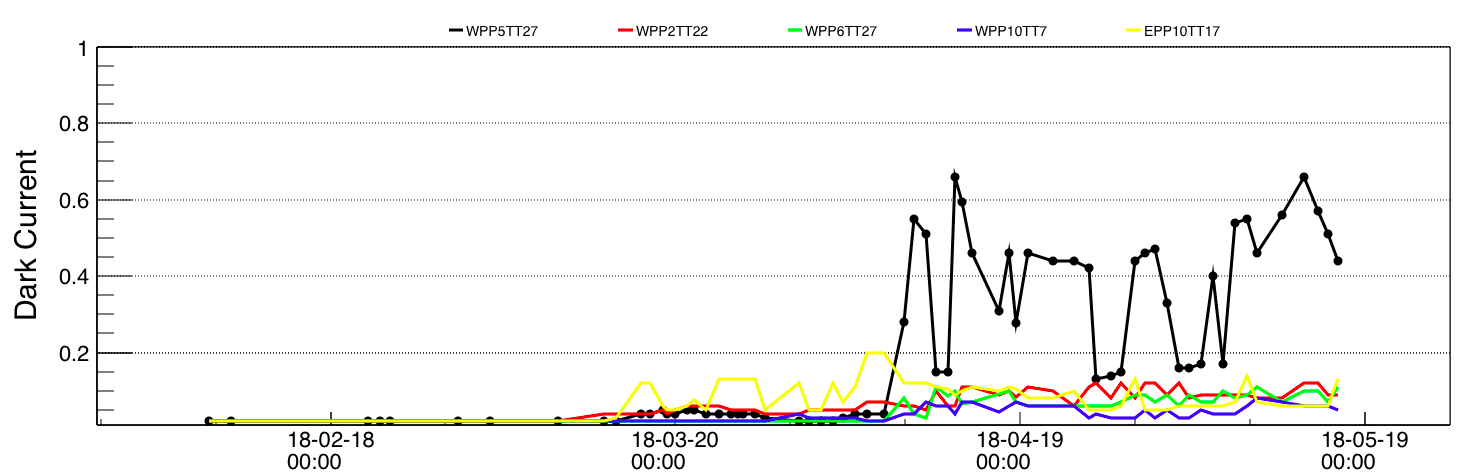
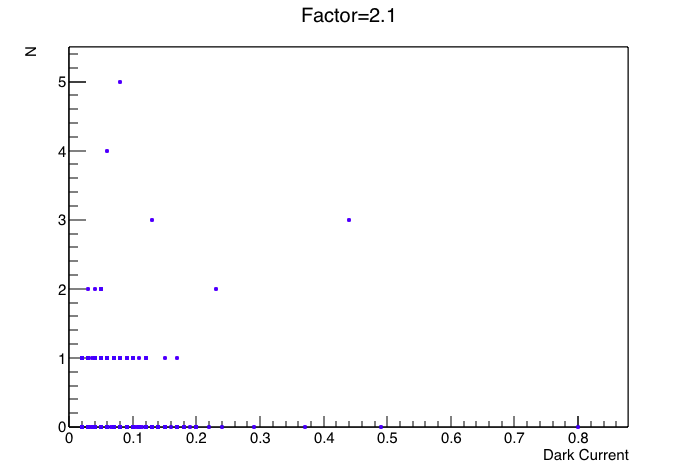
As shown on the above plots, there are 'fluctuations/bumps' on each tile and some tiles look 'crazy', for example, WPP5TT27 and EPP1TT20. One way of measuring the fluctuation of the dark current is to count how many times the dark current drops by a certain factor. For instance, if we set the factor to 2, then we will count how many times the dark current becomes lower than half of the value measured on the previous day. In this study the factor was set to 2.1(in order to rule out the cases where the dark current drops from 0.04 to 0.02 since it is a small change and might be caused by the measurement error) and 1.5. Here are the plots showing the number of times(N) that dc drops by a certain factor vs the dark current measured on the last day(dc). Since some of the dots might be overwrote, we further show the dc distribution for N=0, 1,2. The histogram was scaled so the maximum value was set to 1 for all the different N values.
.png)
.png)

- lxy1122's blog
- Login or register to post comments