Flow de-correlation measurement with EPD
Updated on Mon, 2018-09-10 20:14. Originally created by lxy1122 on 2018-08-25 16:09.
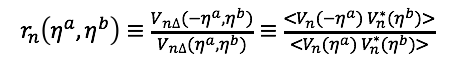


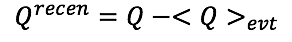


figure 1

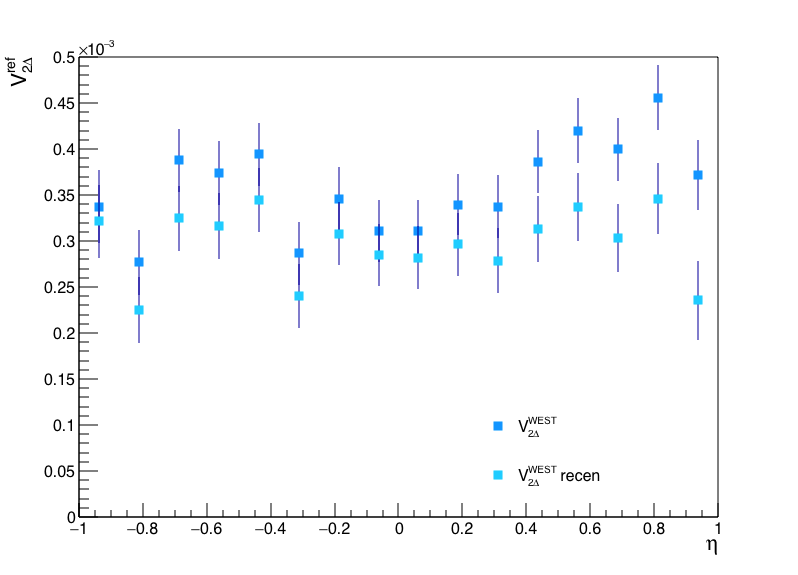
figure 2a figure 2b
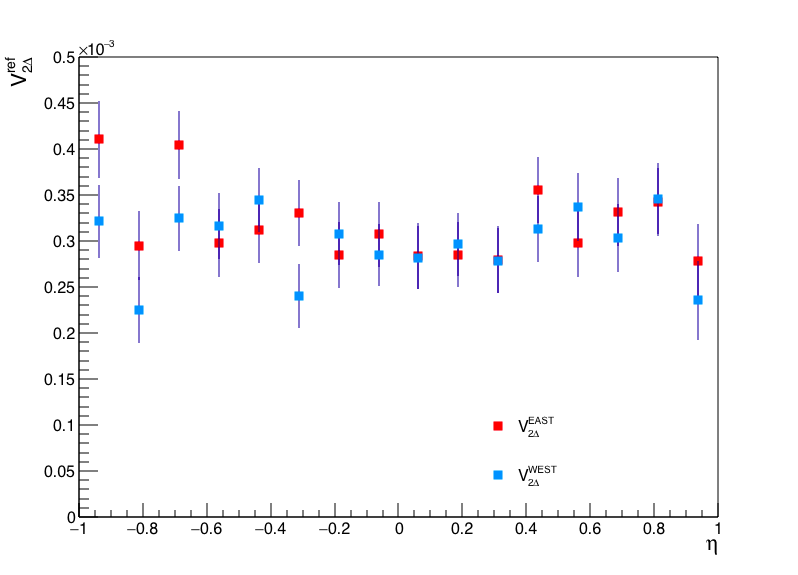
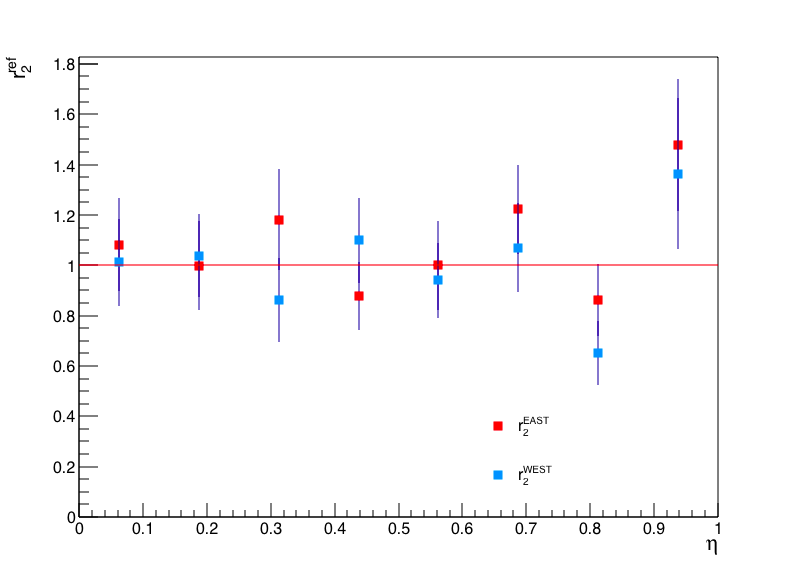
figure 2c figure 2d
In this study, I measured the second order flow de-correlation with the data from AuAu@27GeV and Isobars@200GeV.
The factorization ratio rn is constructed as a measure of the flow decorrelation:
It measures the relative fluctuation between Vn(-eta) and Vn(eta), where Vn is the two particle Fourier coefficient
A and B(or a&b) represents two eta regions(as shown in figure 1): A is the TPC covering |eta|<1.0 and b is the inner rings of the EPD covering 3.28<|eta|<5.1. An eta gap (|eta|>2) is imposed to avoid the short range correlations.
As a reminder, Q vector is defined as
Since the phi distribution might not be flat because the detector is not perfect, we should re-center the Q vector
thus Vn becomes
figure 1
In this study, I used ~1.52M AuAu events and ~3.73M Isobar events. The cuts applied on those events are: centrality between 5%-70% and |Vz|<60.
Results
- AuAu@27GeV
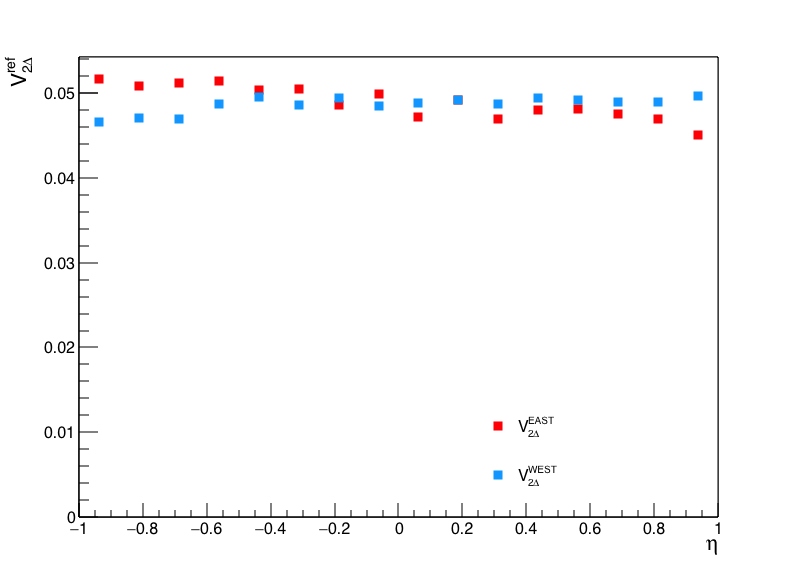
figure 2a figure 2b
figure 2c figure 2d
- Isobar@200GeV
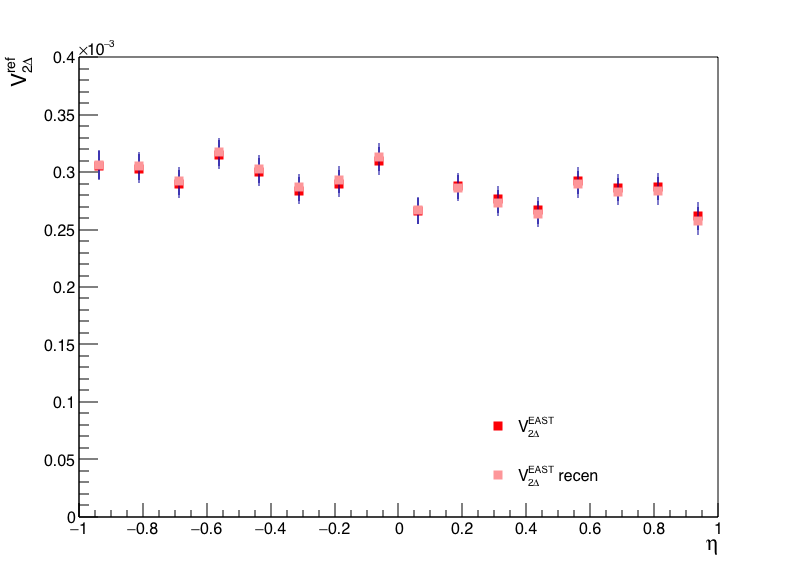

figure 3a figure 3b

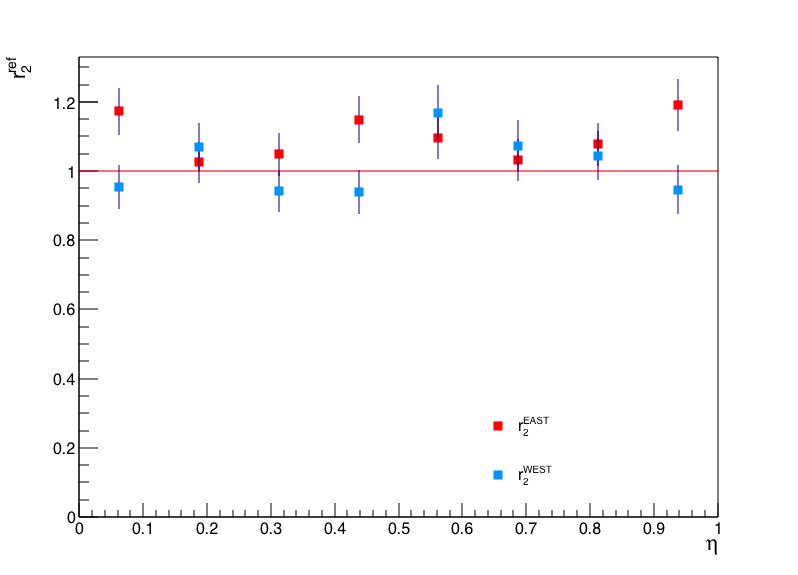
figure 3c figure 3d
- Isobar with resolution correction
I calculated the resolution with three groups of particles
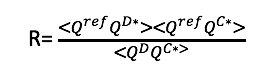 QD is west/east EPD, QC is TPC |eta|<0.5. But I got an unusually small resolution. Reast=0.0037, Rwest=0.0035
Conclusions
- For both Isobars and AuAu, the re-centering influenced Vwest more than Veast and Vn at negative eta more than Vn at positive eta(figure 2a,2b,3a,3b). It makes sense because for TPC, the phi distribution is less flat at negative eta due to the iTPC sector and for EPD, the phi distribution is less flat on the west side due to the FXT holder.
- For the AuAu collisions, the east and west EPD have the same resolution since Vwest is approximately the same as Veast(figure 2c). However, for the isobars, it seems to me that the east EPD has higher resolution than the west EPD. It might because of higher energy, but I don't know the mechanism behind it.
- No flow de-correlation is observed within the current uncertainty, I might need 100 times as much as the current statistics to see the flow de-correlation effect.
»
- lxy1122's blog
- Login or register to post comments